| Open: | - |
| Change: | - |
| Volume: | - |
| Low: | - |
| High: | - |
| High / Low range: | - |
| Type: | Stocks |
| Ticker: | JE. |
| ISIN: | GB00BKX5CN86 |
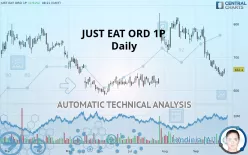
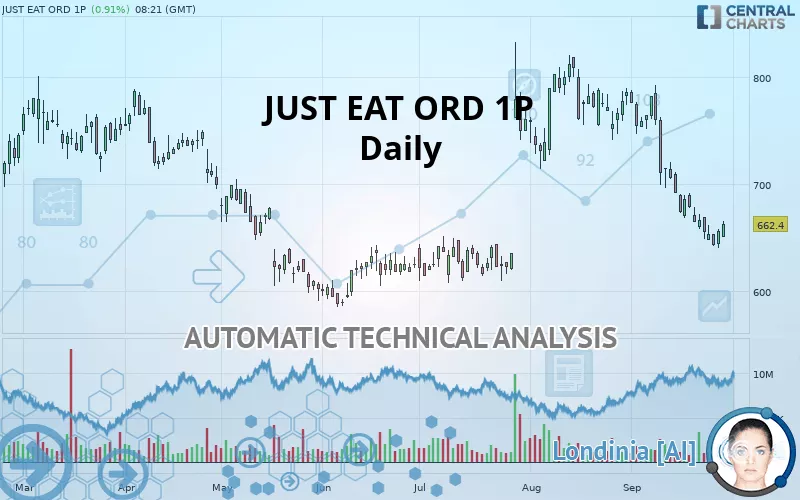
JUST EAT ORD 1P - Daily - Technical analysis published on 09/27/2019 (GMT)
- 285
- 0
- 09/27/2019 - 08:42
- Who voted?
Click here for a new analysis!
- Timeframe : Daily
- - Analysis generated on 09/27/2019 - 08:41
- Status : TARGET REACHED
Summary of the analysis
Additional analysis
Quotes
JUST EAT ORD 1P rating 662.4 GBX. On the day, this instrument gained +0.91% and was between 650.4 GBX and 665.8 GBX. This implies that the price is at +1.85% from its lowest and at -0.51% from its highest.The Central Gaps scanner detects a bearish opening. A small advantage for sellers in the very short term.
Bearish opening
Type : Bearish
Timeframe : Openning
So that you have an overall view of the price change, here is a table showing the variations over several periods:
Near a new LOW record (1 month)
Type : Bearish
Timeframe : Weekly
Technical
Technical analysis of JUST EAT ORD 1P in Daily shows an overall bearish trend. The signals given by moving averages are 75% bearish. This bearish trend is reinforced by the strong signals currently being given by short-term moving averages. The Central Indicators market scanner currently does not detect any result that concerns moving averages.
An assessment of technical indicators does not currently provide any relevant information to suggest whether the signal given by the technical indicators is more bullish or bearish.
Caution: the Central Indicators scanner currently detects an excess:
CCI indicator: bullish divergence
Type : Bullish
Timeframe : Daily
Williams %R indicator is oversold : under -80
Type : Neutral
Timeframe : Daily
Price is back over the pivot point
Type : Bullish
Timeframe : Daily
Price is back under the pivot point
Type : Bearish
Timeframe : Weekly
The Central Patterns scanner, which studies chart patterns, resistances and supports, has identified these signals:
Near horizontal support
Type : Bullish
Timeframe : Daily
Support of channel is broken
Type : Bearish
Timeframe : Daily
The Central Candlesticks scanner which studies Japanese candlesticks did not detect anything.
| S3 | S2 | S1 | Price | R1 | R2 | R3 | |
|---|---|---|---|---|---|---|---|
| ProTrendLines | 588.8 | 613.1 | 641.9 | 662.4 | 715.0 | 754.6 | 787.6 |
| Change (%) | -11.11% | -7.44% | -3.09% | - | +7.94% | +13.92% | +18.90% |
| Change | -73.6 | -49.3 | -20.5 | - | +52.6 | +92.2 | +125.2 |
| Level | Major | Intermediate | Intermediate | - | Intermediate | Major | Major |
Pivot points can also be used to set your price objectives. Here is the price situation in relation to pivot points:
| Pivot points | S3 | S2 | S1 | PP | R1 | R2 | R3 |
|---|---|---|---|---|---|---|---|
| Standard | 627.3 | 633.9 | 645.1 | 651.7 | 662.9 | 669.5 | 680.7 |
| Camarilla | 651.5 | 653.1 | 654.8 | 656.4 | 658.0 | 659.7 | 661.3 |
| Woodie | 629.7 | 635.1 | 647.5 | 652.9 | 665.3 | 670.7 | 683.1 |
| Fibonacci | 633.9 | 640.7 | 644.9 | 651.7 | 658.5 | 662.7 | 669.5 |
| Pivot points | S3 | S2 | S1 | PP | R1 | R2 | R3 |
|---|---|---|---|---|---|---|---|
| Standard | 618.1 | 638.1 | 652.1 | 672.1 | 686.1 | 706.1 | 720.1 |
| Camarilla | 656.9 | 660.0 | 663.1 | 666.2 | 669.3 | 672.4 | 675.6 |
| Woodie | 615.2 | 636.6 | 649.2 | 670.6 | 683.2 | 704.6 | 717.2 |
| Fibonacci | 638.1 | 651.1 | 659.1 | 672.1 | 685.1 | 693.1 | 706.1 |
| Pivot points | S3 | S2 | S1 | PP | R1 | R2 | R3 |
|---|---|---|---|---|---|---|---|
| Standard | 620.5 | 667.5 | 726.7 | 773.7 | 832.9 | 879.9 | 939.1 |
| Camarilla | 756.6 | 766.3 | 776.1 | 785.8 | 795.5 | 805.3 | 815.0 |
| Woodie | 626.5 | 670.6 | 732.7 | 776.8 | 838.9 | 883.0 | 945.1 |
| Fibonacci | 667.5 | 708.1 | 733.2 | 773.7 | 814.3 | 839.4 | 879.9 |
Numerical data
The following is the status of the technical indicators and moving averages at the time of publication of this technical analysis:
| RSI (14): | 37.90 | |
| MACD (12,26,9): | -25.1000 | |
| Directional Movement: | -15.1 | |
| AROON (14): | -92.9 | |
| DEMA (21): | 663.0 | |
| Parabolic SAR (0,02-0,02-0,2): | 689.6 | |
| Elder Ray (13): | -19.1 | |
| Super Trend (3,10): | 706.8 | |
| Zig ZAG (10): | 662.4 | |
| VORTEX (21): | 0.7000 | |
| Stochastique (14,3,5): | 9.70 | |
| TEMA (21): | 637.4 | |
| Williams %R (14): | -82.10 | |
| Chande Momentum Oscillator (20): | -51.4 | |
| Repulse (5,40,3): | 2.3000 | |
| ROCnROLL: | 2 | |
| TRIX (15,9): | -0.4000 | |
| Courbe Coppock: | 24.90 |
| MA7: | 657.3 | |
| MA20: | 702.9 | |
| MA50: | 728.0 | |
| MA100: | 676.8 | |
| MAexp7: | 662.4 | |
| MAexp20: | 692.1 | |
| MAexp50: | 706.2 | |
| MAexp100: | 698.3 | |
| Price / MA7: | +0.78% | |
| Price / MA20: | -5.76% | |
| Price / MA50: | -9.01% | |
| Price / MA100: | -2.13% | |
| Price / MAexp7: | -0% | |
| Price / MAexp20: | -4.29% | |
| Price / MAexp50: | -6.20% | |
| Price / MAexp100: | -5.14% |
News
Don"t forget to follow the news on JUST EAT ORD 1P. At the time of publication of this analysis, the latest news was as follows:
- 09/26/2019 - 13:17 Form 8.3 - The Vanguard Group, Inc.: Just Eat plc
- 09/25/2019 - 12:24 Form 8.3 - The Vanguard Group, Inc.: Just Eat plc
- 09/24/2019 - 12:56 Form 8.3 - The Vanguard Group, Inc.: Just Eat plc
- 09/19/2019 - 13:50 Form 8.3 - The Vanguard Group, Inc.: Just Eat plc
- 09/18/2019 - 13:04 Form 8.3 - The Vanguard Group, Inc.: Just Eat plc
About author

Online


Add a comment
Comments
0 comments on the analysis JUST EAT ORD 1P - Daily