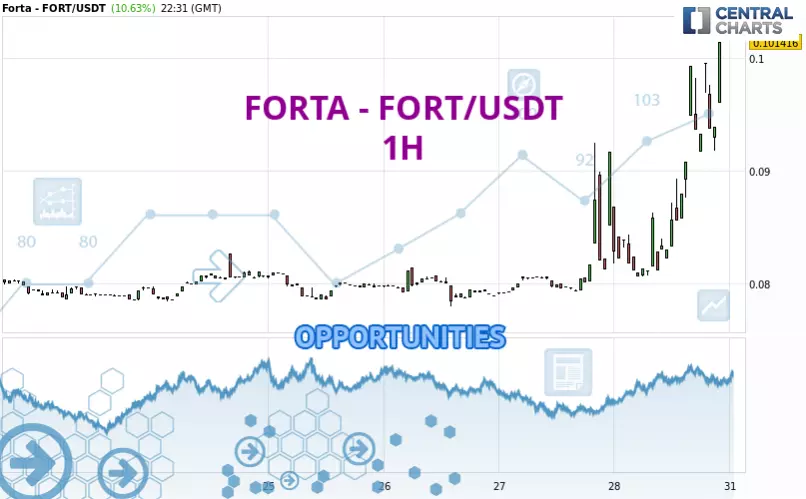
Londinia Opportunities Analyses - 03/28/2025 (GMT) FORTA - FORT/USDT - 1H
| Type: | Cryptocurrencies |
| Ticker: | FORTUSDT |
| ISIN: |
- Cryptocurrencies
- Timeframe : 1H
- - Analysis generated on
- Status : TARGET REACHED
Summary of the analysis

Additional analysis
Quotes
The FORTA - FORT/USDT rating is 0.098567 USDT. The price has increased by +7.52% since the last closing and was traded between 0.080596 USDT and 0.099534 USDT over the period. The price is currently at +22.30% from its lowest and -0.97% from its highest.A bearish opening was detected by the Central Gaps scanner. Sellers are trying to impose a bearish trend in the very short term.
Bearish opening
Type : Bearish
Timeframe : Openning
A study of price movements over other periods shows the following variations:
Technical
A technical analysis in 1H of this FORTA - FORT/USDT chart shows a strongly bullish trend. 92.86% of the signals given by moving averages are bullish. The overall trend is supported by the strong bullish signals from short-term moving averages. There is no crossing of moving average by the price or crossing of moving averages between themselves.
Technical indicators are strongly bullish, suggesting that the price increase should continue.
Other results related to technical indicators were also found by the Central Indicators scanner:
Pivot points : price is over resistance 1 (Daily)
Type : Neutral
Timeframe : 1 hour
Pivot points : price is over resistance 3 (Daily)
Type : Neutral
Timeframe : Weekly
Pivot points : price is over resistance 3 (Weekly)
Type : Neutral
Timeframe : 1 hour
Pivot points : price is over resistance 3 (Monthly)
Type : Neutral
Timeframe : 1 hour
Central Patterns, the scanner specializing in chart patterns, did not identify any signals.
The presence of these bullish Japanese candlestick patterns detected by Central Candlesticks that could cause a very short term rebound were also noted:
White morning star
Type : Bullish
Timeframe : 1 hour
Upside gap
Type : Bullish
Timeframe : 1 hour
| S3 | S2 | S1 | Price | R1 | R2 | R3 | |
|---|---|---|---|---|---|---|---|
| ProTrendLines | 0.082623 | 0.085845 | 0.092527 | 0.098567 | 0.108462 | 0.125304 | 0.176459 |
| Change (%) | -16.18% | -12.91% | -6.13% | - | +10.04% | +27.13% | +79.02% |
| Change | -0.015944 | -0.012722 | -0.006040 | - | +0.009895 | +0.026737 | +0.077892 |
| Level | Minor | Major | Minor | - | Intermediate | Minor | Intermediate |
Pivot points can also be used to set your price objectives. Here is the price situation in relation to pivot points:
| Pivot points | S3 | S2 | S1 | PP | R1 | R2 | R3 |
|---|---|---|---|---|---|---|---|
| Standard | 0.069530 | 0.074300 | 0.082986 | 0.087756 | 0.096442 | 0.101212 | 0.109898 |
| Camarilla | 0.087971 | 0.089204 | 0.090438 | 0.091671 | 0.092905 | 0.094138 | 0.095371 |
| Woodie | 0.071487 | 0.075279 | 0.084943 | 0.088735 | 0.098399 | 0.102191 | 0.111855 |
| Fibonacci | 0.074300 | 0.079441 | 0.082616 | 0.087756 | 0.092897 | 0.096072 | 0.101212 |
| Pivot points | S3 | S2 | S1 | PP | R1 | R2 | R3 |
|---|---|---|---|---|---|---|---|
| Standard | 0.064657 | 0.070576 | 0.075050 | 0.080969 | 0.085443 | 0.091362 | 0.095836 |
| Camarilla | 0.076666 | 0.077619 | 0.078571 | 0.079524 | 0.080477 | 0.081429 | 0.082382 |
| Woodie | 0.063935 | 0.070215 | 0.074328 | 0.080608 | 0.084721 | 0.091001 | 0.095114 |
| Fibonacci | 0.070576 | 0.074546 | 0.076999 | 0.080969 | 0.084939 | 0.087392 | 0.091362 |
| Pivot points | S3 | S2 | S1 | PP | R1 | R2 | R3 |
|---|---|---|---|---|---|---|---|
| Standard | -0.057324 | 0.004402 | 0.043979 | 0.105705 | 0.145282 | 0.207008 | 0.246585 |
| Camarilla | 0.055698 | 0.064984 | 0.074270 | 0.083556 | 0.092842 | 0.102128 | 0.111414 |
| Woodie | -0.068399 | -0.001135 | 0.032905 | 0.100168 | 0.134208 | 0.201471 | 0.235511 |
| Fibonacci | 0.004402 | 0.043100 | 0.067007 | 0.105705 | 0.144403 | 0.168310 | 0.207008 |
Numerical data
The following is the status of the technical indicators and moving averages at the time of publication of this technical analysis:
| RSI (14): | 60.71 | |
| MACD (12,26,9): | 0.0037 | |
| Directional Movement: | 29.926501 | |
| AROON (14): | 71.428572 | |
| DEMA (21): | 0.094319 | |
| Parabolic SAR (0,02-0,02-0,2): | 0.087732 | |
| Elder Ray (13): | 0.004157 | |
| Super Trend (3,10): | 0.086880 | |
| Zig ZAG (10): | 0.096054 | |
| VORTEX (21): | 0.9163 | |
| Stochastique (14,3,5): | 73.10 | |
| TEMA (21): | 0.096509 | |
| Williams %R (14): | -18.95 | |
| Chande Momentum Oscillator (20): | 0.012692 | |
| Repulse (5,40,3): | 0.4230 | |
| ROCnROLL: | 1 | |
| TRIX (15,9): | 0.4993 | |
| Courbe Coppock: | 29.70 |
| MA7: | 0.083732 | |
| MA20: | 0.084048 | |
| MA50: | 0.085875 | |
| MA100: | 0.096976 | |
| MAexp7: | 0.094174 | |
| MAexp20: | 0.089837 | |
| MAexp50: | 0.085535 | |
| MAexp100: | 0.083218 | |
| Price / MA7: | +17.72% | |
| Price / MA20: | +17.27% | |
| Price / MA50: | +14.78% | |
| Price / MA100: | +1.64% | |
| Price / MAexp7: | +4.66% | |
| Price / MAexp20: | +9.72% | |
| Price / MAexp50: | +15.24% | |
| Price / MAexp100: | +18.44% |