Londinia Opportunities Analyses - 03/24/2025 (GMT) NZD/DKK - 1H
- FX/Indices
- Timeframe : 1H
- - Analysis generated on
- Status : INVALID
Summary of the analysis

Additional analysis
Quotes
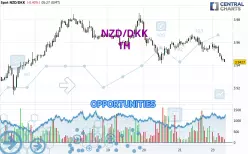
The NZD/DKK price is 3.9432 DKK. On the day, this instrument lost -0.39% and was between 3.9430 DKK and 3.9600 DKK. This implies that the price is at +0.01% from its lowest and at -0.42% from its highest.The Central Gaps scanner detects a bearish opening marking the presence of sellers ahead of buyers at the opening but not sufficiently marked to allow the price to register a quotation gap.
Bearish opening
Type : Bearish
Timeframe : Openning
So that you have an overall view of the price change, here is a table showing the variations over several periods:
Near a new LOW record (5 years)
Type : Bearish
Timeframe : Weekly
Near a new LOW record (1 year)
Type : Bearish
Timeframe : Weekly
Near a new HIGH record (1st january)
Type : Bullish
Timeframe : Weekly
Near a new HIGH record (1 month)
Type : Bullish
Timeframe : Weekly
Technical
A technical analysis in 1H of this NZD/DKK chart shows a sharp bearish trend. 89.29% of the signals given by moving averages are bearish. The overall trend is supported by the strong bearish signals from short-term moving averages. The Central Indicators market scanner currently does not detect any result that concerns moving averages.
In fact, 13 technical indicators on 18 studied are currently positioned bearish. Caution: the Central Indicators scanner currently detects an excess:
CCI indicator is oversold : under -100
Type : Neutral
Timeframe : 1 hour
Williams %R indicator is oversold : under -80
Type : Neutral
Timeframe : 1 hour
Pivot points : price is under support 1 (Daily)
Type : Neutral
Timeframe : 1 hour
Central Patterns, the market scanner focusing on chart patterns, resistances and supports found these results:
Near horizontal support
Type : Bullish
Timeframe : 1 hour
Support of channel is broken
Type : Bearish
Timeframe : 1 hour
The Central Candlesticks scanner currently notes the presence of this pattern in Japanese candlesticks that could mark the end of the short-term trend currently underway:
White hanging man / hammer
Type : Neutral
Timeframe : 1 hour
| S3 | S2 | S1 | Price | R1 | R2 | R3 | |
|---|---|---|---|---|---|---|---|
| ProTrendLines | 3.8975 | 3.9142 | 3.9413 | 3.9432 | 3.9550 | 3.9669 | 3.9858 |
| Change (%) | -1.16% | -0.74% | -0.05% | - | +0.30% | +0.60% | +1.08% |
| Change | -0.0457 | -0.0290 | -0.0019 | - | +0.0118 | +0.0237 | +0.0426 |
| Level | Major | Minor | Major | - | Minor | Minor | Intermediate |
Pivot points can also be used to set your price objectives. Here is the price situation in relation to pivot points:
| Pivot points | S3 | S2 | S1 | PP | R1 | R2 | R3 |
|---|---|---|---|---|---|---|---|
| Standard | 3.9354 | 3.9434 | 3.9510 | 3.9590 | 3.9666 | 3.9746 | 3.9822 |
| Camarilla | 3.9544 | 3.9558 | 3.9573 | 3.9587 | 3.9601 | 3.9616 | 3.9630 |
| Woodie | 3.9353 | 3.9433 | 3.9509 | 3.9589 | 3.9665 | 3.9745 | 3.9821 |
| Fibonacci | 3.9434 | 3.9493 | 3.9530 | 3.9590 | 3.9649 | 3.9686 | 3.9746 |
| Pivot points | S3 | S2 | S1 | PP | R1 | R2 | R3 |
|---|---|---|---|---|---|---|---|
| Standard | 3.8897 | 3.9144 | 3.9365 | 3.9612 | 3.9833 | 4.0080 | 4.0301 |
| Camarilla | 3.9458 | 3.9501 | 3.9544 | 3.9587 | 3.9630 | 3.9673 | 3.9716 |
| Woodie | 3.8885 | 3.9138 | 3.9353 | 3.9606 | 3.9821 | 4.0074 | 4.0289 |
| Fibonacci | 3.9144 | 3.9322 | 3.9433 | 3.9612 | 3.9790 | 3.9901 | 4.0080 |
| Pivot points | S3 | S2 | S1 | PP | R1 | R2 | R3 |
|---|---|---|---|---|---|---|---|
| Standard | 3.8943 | 3.9528 | 3.9879 | 4.0464 | 4.0815 | 4.1400 | 4.1751 |
| Camarilla | 3.9973 | 4.0058 | 4.0144 | 4.0230 | 4.0316 | 4.0402 | 4.0487 |
| Woodie | 3.8826 | 3.9470 | 3.9762 | 4.0406 | 4.0698 | 4.1342 | 4.1634 |
| Fibonacci | 3.9528 | 3.9886 | 4.0106 | 4.0464 | 4.0822 | 4.1042 | 4.1400 |
Numerical data
The following is the status of technical indicators and moving averages registered at the time this technical analysis was created:
| RSI (14): | 32.56 | |
| MACD (12,26,9): | -0.0030 | |
| Directional Movement: | -21.7024 | |
| AROON (14): | -100.0000 | |
| DEMA (21): | 3.9505 | |
| Parabolic SAR (0,02-0,02-0,2): | 3.9556 | |
| Elder Ray (13): | -0.0075 | |
| Super Trend (3,10): | 3.9576 | |
| Zig ZAG (10): | 3.9444 | |
| VORTEX (21): | 0.7801 | |
| Stochastique (14,3,5): | 6.82 | |
| TEMA (21): | 3.9471 | |
| Williams %R (14): | -88.55 | |
| Chande Momentum Oscillator (20): | -0.0084 | |
| Repulse (5,40,3): | -0.0895 | |
| ROCnROLL: | 2 | |
| TRIX (15,9): | -0.0068 | |
| Courbe Coppock: | 0.44 |
| MA7: | 3.9616 | |
| MA20: | 3.9700 | |
| MA50: | 4.0284 | |
| MA100: | 4.0692 | |
| MAexp7: | 3.9484 | |
| MAexp20: | 3.9539 | |
| MAexp50: | 3.9570 | |
| MAexp100: | 3.9567 | |
| Price / MA7: | -0.46% | |
| Price / MA20: | -0.68% | |
| Price / MA50: | -2.11% | |
| Price / MA100: | -3.10% | |
| Price / MAexp7: | -0.13% | |
| Price / MAexp20: | -0.27% | |
| Price / MAexp50: | -0.35% | |
| Price / MAexp100: | -0.34% |