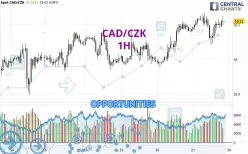
Londinia Opportunities Analyses - 03/23/2025 (GMT) CAD/CZK - 1H
- FX/Indices
- Timeframe : 1H
- - Analysis generated on
- Status : LEVEL MAINTAINED
Summary of the analysis

Additional analysis
Quotes
The CAD/CZK rating is 16.110 CZK. The price has increased by +0.14% since the last closing with the lowest point at 16.041 CZK and the highest point at 16.134 CZK. The deviation from the price is +0.43% for the low point and -0.15% for the high point.Here is a more detailed summary of the historical variations registered by CAD/CZK:
Near a new LOW record (5 years)
Type : Bearish
Timeframe : Weekly
Near a new LOW record (1 year)
Type : Bearish
Timeframe : Weekly
Near a new LOW record (1st january)
Type : Bearish
Timeframe : Weekly
Near a new HIGH record (1 month)
Type : Bullish
Timeframe : Weekly
Technical
Technical analysis of CAD/CZK in 1H shows a strongly overall bullish trend. 92.86% of the signals given by moving averages are bullish. The overall trend is supported by the strong bullish signals from short-term moving averages. An assessment of moving averages reveals a bullish signal that could impact this trend:
Moving Average bullish crossovers : AMA50 & AMA100
Type : Bullish
Timeframe : 1 hour
In fact, 12 technical indicators on 18 studied are currently bullish. The Central Indicators scanner found this result concerning these indicators:
Momentum indicator is back under 0
Type : Bearish
Timeframe : 1 hour
The Central Patterns scanner, which studies chart patterns, resistances and supports, has identified this signal:
Near support of channel
Type : Bullish
Timeframe : 1 hour
There is also a Japanese candlestick pattern detected by Central Candlesticks that could mark the end of the current short-term trend:
Doji
Type : Neutral
Timeframe : 1 hour
| S3 | S2 | S1 | Price | R1 | R2 | R3 | |
|---|---|---|---|---|---|---|---|
| ProTrendLines | 15.864 | 15.899 | 15.967 | 16.110 | 16.112 | 16.471 | 16.699 |
| Change (%) | -1.53% | -1.31% | -0.89% | - | +0.01% | +2.24% | +3.66% |
| Change | -0.246 | -0.211 | -0.143 | - | +0.002 | +0.361 | +0.589 |
| Level | Intermediate | Minor | Major | - | Intermediate | Major | Intermediate |
Attention could also be paid to pivot points to set price objectives:
| Pivot points | S3 | S2 | S1 | PP | R1 | R2 | R3 |
|---|---|---|---|---|---|---|---|
| Standard | 15.869 | 15.922 | 16.005 | 16.058 | 16.141 | 16.194 | 16.277 |
| Camarilla | 16.050 | 16.062 | 16.075 | 16.087 | 16.100 | 16.112 | 16.124 |
| Woodie | 15.883 | 15.930 | 16.019 | 16.066 | 16.155 | 16.202 | 16.291 |
| Fibonacci | 15.922 | 15.974 | 16.006 | 16.058 | 16.110 | 16.142 | 16.194 |
| Pivot points | S3 | S2 | S1 | PP | R1 | R2 | R3 |
|---|---|---|---|---|---|---|---|
| Standard | 15.447 | 15.602 | 15.803 | 15.958 | 16.159 | 16.314 | 16.515 |
| Camarilla | 15.907 | 15.940 | 15.972 | 16.005 | 16.038 | 16.070 | 16.103 |
| Woodie | 15.471 | 15.614 | 15.827 | 15.970 | 16.183 | 16.326 | 16.539 |
| Fibonacci | 15.602 | 15.738 | 15.822 | 15.958 | 16.094 | 16.178 | 16.314 |
| Pivot points | S3 | S2 | S1 | PP | R1 | R2 | R3 |
|---|---|---|---|---|---|---|---|
| Standard | 15.924 | 16.217 | 16.459 | 16.752 | 16.994 | 17.287 | 17.529 |
| Camarilla | 16.553 | 16.602 | 16.651 | 16.700 | 16.749 | 16.798 | 16.847 |
| Woodie | 15.898 | 16.204 | 16.433 | 16.739 | 16.968 | 17.274 | 17.503 |
| Fibonacci | 16.217 | 16.422 | 16.548 | 16.752 | 16.957 | 17.083 | 17.287 |
Numerical data
The following is the status of technical indicators and moving averages registered at the time this technical analysis was created:
| RSI (14): | 58.98 | |
| MACD (12,26,9): | 0.0080 | |
| Directional Movement: | 10.233 | |
| AROON (14): | -28.571 | |
| DEMA (21): | 16.108 | |
| Parabolic SAR (0,02-0,02-0,2): | 16.049 | |
| Elder Ray (13): | 0.010 | |
| Super Trend (3,10): | 16.126 | |
| Zig ZAG (10): | 16.110 | |
| VORTEX (21): | 1.0580 | |
| Stochastique (14,3,5): | 74.19 | |
| TEMA (21): | 16.104 | |
| Williams %R (14): | -25.81 | |
| Chande Momentum Oscillator (20): | -0.005 | |
| Repulse (5,40,3): | 0.0480 | |
| ROCnROLL: | 1 | |
| TRIX (15,9): | 0.0080 | |
| Courbe Coppock: | 0.08 |
| MA7: | 16.043 | |
| MA20: | 16.233 | |
| MA50: | 16.621 | |
| MA100: | 16.780 | |
| MAexp7: | 16.104 | |
| MAexp20: | 16.096 | |
| MAexp50: | 16.076 | |
| MAexp100: | 16.054 | |
| Price / MA7: | +0.42% | |
| Price / MA20: | -0.76% | |
| Price / MA50: | -3.07% | |
| Price / MA100: | -3.99% | |
| Price / MAexp7: | +0.04% | |
| Price / MAexp20: | +0.09% | |
| Price / MAexp50: | +0.21% | |
| Price / MAexp100: | +0.35% |