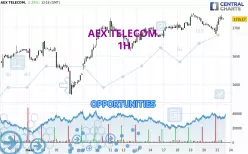
Londinia Opportunities Analyses - 03/21/2025 (GMT) AEX TELECOM. - 1H
| Type: | Indices |
| Ticker: | NLTEL |
| ISIN: | QS0011016589 |
- FX/Indices
- Timeframe : 1H
- - Analysis generated on 03/21/2025 - 12:32
- Status : INVALID
Summary of the analysis

Additional analysis
Quotes
AEX TELECOM. rating 1,715.17 EUR. On the day, this instrument gained +1.55% and was between 1,694.93 EUR and 1,722.82 EUR. This implies that the price is at +1.19% from its lowest and at -0.44% from its highest.A bullish opening was detected by the Central Gaps scanner. Buyers are trying to impose a bullish momentum in the very short term.
Bullish opening
Type : Bullish
Timeframe : Openning
So that you have an overall view of the price change, here is a table showing the variations over several periods:
New HIGH record (5 years)
Type : Bullish
Timeframe : Weekly
Near a new HIGH record (1 year)
Type : Bullish
Timeframe : Weekly
Near a new HIGH record (1st january)
Type : Bullish
Timeframe : Weekly
Near a new HIGH record (1 month)
Type : Bullish
Timeframe : Weekly
Technical
A technical analysis in 1H of this AEX TELECOM. chart shows a strongly bullish trend. The signals given by moving averages are 89.29% bullish. This strongly bullish trend seems to be running out of steam given the signals being given by short-term moving averages. The Central Indicators scanner detects a bearish signal on moving averages that could impact this trend:
Moving Average bearish crossovers : AMA50 & AMA100
Type : Bearish
Timeframe : 1 hour
Technical indicators are strongly bullish, suggesting that the price increase should continue.
But beware of excesses. The Central Indicators scanner currently detects this:
Williams %R indicator is overbought : over -20
Type : Neutral
Timeframe : 1 hour
Pivot points : price is over resistance 1 (Daily)
Type : Neutral
Timeframe : 1 hour
Price is back over the pivot point (Daily)
Type : Bullish
Timeframe : Weekly
Central Patterns, the scanner specializing in chart patterns, did not identify any signals.
The Central Candlesticks scanner, specialised in Japanese candlesticks, did not identify any signals.
| S3 | S2 | S1 | Price | R1 | R2 | |
|---|---|---|---|---|---|---|
| ProTrendLines | 1,678.74 | 1,695.08 | 1,709.32 | 1,715.17 | 1,725.97 | 2,012.45 |
| Change (%) | -2.12% | -1.17% | -0.34% | - | +0.63% | +17.33% |
| Change | -36.43 | -20.09 | -5.85 | - | +10.80 | +297.28 |
| Level | Major | Intermediate | Major | - | Minor | Intermediate |
To determine price objectives, it is also possible to use the pivot points. Here is the price position in relation to pivot points:
| Pivot points | S3 | S2 | S1 | PP | R1 | R2 | R3 |
|---|---|---|---|---|---|---|---|
| Standard | 1,660.29 | 1,674.69 | 1,681.88 | 1,696.28 | 1,703.47 | 1,717.87 | 1,725.06 |
| Camarilla | 1,683.14 | 1,685.12 | 1,687.10 | 1,689.08 | 1,691.06 | 1,693.04 | 1,695.02 |
| Woodie | 1,656.70 | 1,672.89 | 1,678.29 | 1,694.48 | 1,699.88 | 1,716.07 | 1,721.47 |
| Fibonacci | 1,674.69 | 1,682.93 | 1,688.03 | 1,696.28 | 1,704.52 | 1,709.62 | 1,717.87 |
| Pivot points | S3 | S2 | S1 | PP | R1 | R2 | R3 |
|---|---|---|---|---|---|---|---|
| Standard | 1,600.76 | 1,629.85 | 1,658.79 | 1,687.88 | 1,716.82 | 1,745.91 | 1,774.85 |
| Camarilla | 1,671.77 | 1,677.09 | 1,682.41 | 1,687.73 | 1,693.05 | 1,698.37 | 1,703.69 |
| Woodie | 1,600.69 | 1,629.81 | 1,658.72 | 1,687.84 | 1,716.75 | 1,745.87 | 1,774.78 |
| Fibonacci | 1,629.85 | 1,652.02 | 1,665.71 | 1,687.88 | 1,710.05 | 1,723.74 | 1,745.91 |
| Pivot points | S3 | S2 | S1 | PP | R1 | R2 | R3 |
|---|---|---|---|---|---|---|---|
| Standard | 1,462.53 | 1,506.31 | 1,580.83 | 1,624.61 | 1,699.13 | 1,742.91 | 1,817.43 |
| Camarilla | 1,622.82 | 1,633.66 | 1,644.51 | 1,655.35 | 1,666.19 | 1,677.04 | 1,687.88 |
| Woodie | 1,477.90 | 1,514.00 | 1,596.20 | 1,632.30 | 1,714.50 | 1,750.60 | 1,832.80 |
| Fibonacci | 1,506.31 | 1,551.50 | 1,579.42 | 1,624.61 | 1,669.80 | 1,697.72 | 1,742.91 |
Numerical data
The following is the status of technical indicators and moving averages registered at the time this technical analysis was created:
| RSI (14): | 58.98 | |
| MACD (12,26,9): | 2.0000 | |
| Directional Movement: | 8.15 | |
| AROON (14): | 28.57 | |
| DEMA (21): | 1,710.25 | |
| Parabolic SAR (0,02-0,02-0,2): | 1,694.49 | |
| Elder Ray (13): | 6.84 | |
| Super Trend (3,10): | 1,694.48 | |
| Zig ZAG (10): | 1,716.07 | |
| VORTEX (21): | 0.9200 | |
| Stochastique (14,3,5): | 85.28 | |
| TEMA (21): | 1,709.64 | |
| Williams %R (14): | -18.67 | |
| Chande Momentum Oscillator (20): | 10.34 | |
| Repulse (5,40,3): | 0.1700 | |
| ROCnROLL: | 1 | |
| TRIX (15,9): | 0.0100 | |
| Courbe Coppock: | 0.39 |
| MA7: | 1,701.10 | |
| MA20: | 1,669.88 | |
| MA50: | 1,620.99 | |
| MA100: | 1,617.30 | |
| MAexp7: | 1,711.12 | |
| MAexp20: | 1,707.83 | |
| MAexp50: | 1,702.03 | |
| MAexp100: | 1,687.76 | |
| Price / MA7: | +0.83% | |
| Price / MA20: | +2.71% | |
| Price / MA50: | +5.81% | |
| Price / MA100: | +6.05% | |
| Price / MAexp7: | +0.24% | |
| Price / MAexp20: | +0.43% | |
| Price / MAexp50: | +0.77% | |
| Price / MAexp100: | +1.62% |