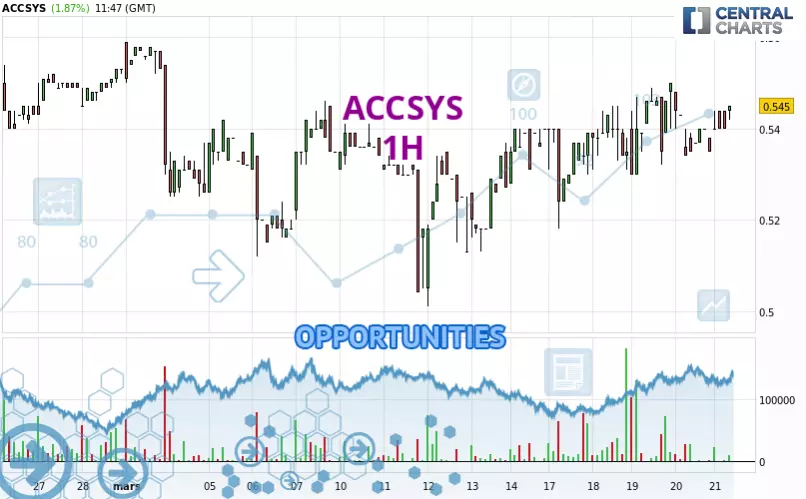
Londinia Opportunities Analyses - 03/21/2025 (GMT) ACCSYS - 1H
| Type: | Stocks |
| Ticker: | AXS |
| ISIN: | GB00BQQFX454 |
- Europe Stocks
- Timeframe : 1H
- - Analysis generated on
- Status : INVALID
Summary of the analysis

Additional analysis
Quotes
The ACCSYS price is 0.5450 EUR. The price has increased by +1.87% since the last closing and was traded between 0.5400 EUR and 0.5450 EUR over the period. The price is currently at +0.93% from its lowest and 0% from its highest.The Central Gaps scanner detects a bullish opening marking the presence of buyers ahead of sellers at the opening but not sufficiently marked to allow the price to register a quotation gap.
Bullish opening
Type : Bullish
Timeframe : Openning
Here is a more detailed summary of the historical variations registered by ACCSYS:
Near a new HIGH record (1 month)
Type : Bullish
Timeframe : Weekly
Abnormal volumes on ACCSYS were detected by the Central Volumes scanner:
Abnormal volumes
Timeframe : 20 days
Abnormal volumes
Timeframe : 50 days
Technical
Technical analysis of ACCSYS in 1H shows a strongly overall bullish trend. 92.86% of the signals given by moving averages are bullish. This strongly bullish trend is supported by the strong bullish signals given by short-term moving averages. An assessment of moving averages reveals a bullish signal that could impact this trend:
Bullish price crossover with Moving Average 20
Type : Bullish
Timeframe : 1 hour
In fact, Central Analyzer took into account 18 technical indicators and the result was as follows: 11 are bullish, 3 are neutral and 4 are bearish. Central Indicators, the scanner specialised in technical indicators, has identified these signals:
Pivot points : price is over resistance 1 (Daily)
Type : Neutral
Timeframe : 1 hour
Williams %R indicator is back over -50
Type : Bullish
Timeframe : 1 hour
Central Patterns, the market scanner focusing on chart patterns, resistances and supports found this result:
Near resistance of channel
Type : Bearish
Timeframe : 1 hour
The Central Candlesticks scanner, specialised in Japanese candlesticks, did not identify any signals.
| S3 | S2 | S1 | Price | R1 | R2 | R3 | |
|---|---|---|---|---|---|---|---|
| ProTrendLines | 0.5123 | 0.5320 | 0.5402 | 0.5450 | 0.5515 | 0.5590 | 0.6189 |
| Change (%) | -6.00% | -2.39% | -0.88% | - | +1.19% | +2.57% | +13.56% |
| Change | -0.0327 | -0.0130 | -0.0048 | - | +0.0065 | +0.0140 | +0.0739 |
| Level | Intermediate | Major | Intermediate | - | Major | Minor | Minor |
Attention could also be paid to pivot points to set price objectives:
| Pivot points | S3 | S2 | S1 | PP | R1 | R2 | R3 |
|---|---|---|---|---|---|---|---|
| Standard | 0.5160 | 0.5250 | 0.5300 | 0.5390 | 0.5440 | 0.5530 | 0.5580 |
| Camarilla | 0.5312 | 0.5324 | 0.5337 | 0.5350 | 0.5363 | 0.5376 | 0.5389 |
| Woodie | 0.5140 | 0.5240 | 0.5280 | 0.5380 | 0.5420 | 0.5520 | 0.5560 |
| Fibonacci | 0.5250 | 0.5304 | 0.5337 | 0.5390 | 0.5444 | 0.5477 | 0.5530 |
| Pivot points | S3 | S2 | S1 | PP | R1 | R2 | R3 |
|---|---|---|---|---|---|---|---|
| Standard | 0.4737 | 0.4873 | 0.5137 | 0.5273 | 0.5537 | 0.5673 | 0.5937 |
| Camarilla | 0.5290 | 0.5327 | 0.5363 | 0.5400 | 0.5437 | 0.5473 | 0.5510 |
| Woodie | 0.4800 | 0.4905 | 0.5200 | 0.5305 | 0.5600 | 0.5705 | 0.6000 |
| Fibonacci | 0.4873 | 0.5026 | 0.5121 | 0.5273 | 0.5426 | 0.5521 | 0.5673 |
| Pivot points | S3 | S2 | S1 | PP | R1 | R2 | R3 |
|---|---|---|---|---|---|---|---|
| Standard | 0.4233 | 0.4497 | 0.5013 | 0.5277 | 0.5793 | 0.6057 | 0.6573 |
| Camarilla | 0.5316 | 0.5387 | 0.5459 | 0.5530 | 0.5602 | 0.5673 | 0.5745 |
| Woodie | 0.4360 | 0.4560 | 0.5140 | 0.5340 | 0.5920 | 0.6120 | 0.6700 |
| Fibonacci | 0.4497 | 0.4795 | 0.4979 | 0.5277 | 0.5575 | 0.5759 | 0.6057 |
Numerical data
The following is the status of technical indicators and moving averages registered at the time this technical analysis was created:
| RSI (14): | 56.18 | |
| MACD (12,26,9): | 0.0009 | |
| Directional Movement: | -1.2301 | |
| AROON (14): | 14.2857 | |
| DEMA (21): | 0.5412 | |
| Parabolic SAR (0,02-0,02-0,2): | 0.5356 | |
| Elder Ray (13): | 0.0033 | |
| Super Trend (3,10): | 0.5264 | |
| Zig ZAG (10): | 0.5450 | |
| VORTEX (21): | 0.9716 | |
| Stochastique (14,3,5): | 52.55 | |
| TEMA (21): | 0.5406 | |
| Williams %R (14): | -31.25 | |
| Chande Momentum Oscillator (20): | -0.0050 | |
| Repulse (5,40,3): | -0.8907 | |
| ROCnROLL: | 1 | |
| TRIX (15,9): | 0.0258 | |
| Courbe Coppock: | 0.82 |
| MA7: | 0.5387 | |
| MA20: | 0.5334 | |
| MA50: | 0.5283 | |
| MA100: | 0.5511 | |
| MAexp7: | 0.5407 | |
| MAexp20: | 0.5398 | |
| MAexp50: | 0.5375 | |
| MAexp100: | 0.5345 | |
| Price / MA7: | +1.17% | |
| Price / MA20: | +2.17% | |
| Price / MA50: | +3.16% | |
| Price / MA100: | -1.11% | |
| Price / MAexp7: | +0.80% | |
| Price / MAexp20: | +0.96% | |
| Price / MAexp50: | +1.40% | |
| Price / MAexp100: | +1.96% |
News
The last news published on ACCSYS at the time of the generation of this analysis was as follows:
- Green Light for Accsys’ New Accoya® Production Plant in USA
- Accsys Improves Accoya® Production With Hi-Tech New Arnhem Wood Handling Equipment
- Edison Investment Research Limited: Accsys Technologies (AXS): Building on strong foundations
-
 Accsys Technologies
-
Accsys Technologies