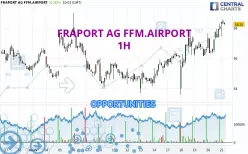
Londinia Opportunities Analyses - 03/21/2025 (GMT) FRAPORT AG FFM.AIRPORT - 1H
| Type: | Stocks |
| Ticker: | FRA |
| ISIN: | DE0005773303 |
- Europe Stocks
- Timeframe : 1H
- - Analysis generated on
- Status : TARGET REACHED
Summary of the analysis

Additional analysis
Quotes
FRAPORT AG FFM.AIRPORT rating 58.25 EUR. The price has increased by +0.26% since the last closing with the lowest point at 57.45 EUR and the highest point at 58.60 EUR. The deviation from the price is +1.39% for the low point and -0.60% for the high point.A study of price movements over other periods shows the following variations:
Near a new HIGH record (1 year)
Type : Bullish
Timeframe : Weekly
Near a new HIGH record (1st january)
Type : Bullish
Timeframe : Weekly
Near a new HIGH record (1 month)
Type : Bullish
Timeframe : Weekly
Technical
A technical analysis in 1H of this FRAPORT AG FFM.AIRPORT chart shows a strongly bullish trend. The signals given by the moving averages are 92.86% bullish. This strong bullish trend is confirmed by the strong signals currently being given by short-term moving averages. The Central Indicators market scanner currently does not detect any result that concerns moving averages.
The probability of a further increase is high given the direction of the technical indicators.
Central Indicators, the scanner specialised in technical indicators, has identified these signals:
Pivot points : price is over resistance 2 (Daily)
Type : Neutral
Timeframe : Weekly
Pivot points : price is over resistance 2 (Weekly)
Type : Neutral
Timeframe : 1 hour
Pivot points : price is over resistance 2 (Monthly)
Type : Neutral
Timeframe : 1 hour
The Central Patterns scanner, which studies chart patterns, resistances and supports, has identified this signal:
Near resistance of channel
Type : Bearish
Timeframe : 1 hour
For a small setback in the very short term, the Central Candlesticks scanner currently notes the presence of this bearish pattern in Japanese candlesticks:
Bearish engulfing lines
Type : Bearish
Timeframe : 1 hour
| S3 | S2 | S1 | Price | R1 | R2 | R3 | |
|---|---|---|---|---|---|---|---|
| ProTrendLines | 56.15 | 56.80 | 57.85 | 58.25 | 58.50 | 59.00 | 59.68 |
| Change (%) | -3.61% | -2.49% | -0.69% | - | +0.43% | +1.29% | +2.45% |
| Change | -2.10 | -1.45 | -0.40 | - | +0.25 | +0.75 | +1.43 |
| Level | Intermediate | Major | Minor | - | Minor | Intermediate | Major |
Pivot points can also be used to set your price objectives. Here is the price situation in relation to pivot points:
| Pivot points | S3 | S2 | S1 | PP | R1 | R2 | R3 |
|---|---|---|---|---|---|---|---|
| Standard | 54.83 | 55.57 | 56.83 | 57.57 | 58.83 | 59.57 | 60.83 |
| Camarilla | 57.55 | 57.73 | 57.92 | 58.10 | 58.28 | 58.47 | 58.65 |
| Woodie | 55.10 | 55.70 | 57.10 | 57.70 | 59.10 | 59.70 | 61.10 |
| Fibonacci | 55.57 | 56.33 | 56.80 | 57.57 | 58.33 | 58.80 | 59.57 |
| Pivot points | S3 | S2 | S1 | PP | R1 | R2 | R3 |
|---|---|---|---|---|---|---|---|
| Standard | 52.07 | 52.88 | 54.37 | 55.18 | 56.67 | 57.48 | 58.97 |
| Camarilla | 55.22 | 55.43 | 55.64 | 55.85 | 56.06 | 56.27 | 56.48 |
| Woodie | 52.40 | 53.05 | 54.70 | 55.35 | 57.00 | 57.65 | 59.30 |
| Fibonacci | 52.88 | 53.76 | 54.31 | 55.18 | 56.06 | 56.61 | 57.48 |
| Pivot points | S3 | S2 | S1 | PP | R1 | R2 | R3 |
|---|---|---|---|---|---|---|---|
| Standard | 46.67 | 50.03 | 52.77 | 56.13 | 58.87 | 62.23 | 64.97 |
| Camarilla | 53.82 | 54.38 | 54.94 | 55.50 | 56.06 | 56.62 | 57.18 |
| Woodie | 46.35 | 49.88 | 52.45 | 55.98 | 58.55 | 62.08 | 64.65 |
| Fibonacci | 50.03 | 52.36 | 53.80 | 56.13 | 58.46 | 59.90 | 62.23 |
Numerical data
The following is the status of the technical indicators and moving averages at the time of publication of this technical analysis:
| RSI (14): | 63.80 | |
| MACD (12,26,9): | 0.4900 | |
| Directional Movement: | 15.05 | |
| AROON (14): | 92.86 | |
| DEMA (21): | 57.85 | |
| Parabolic SAR (0,02-0,02-0,2): | 56.56 | |
| Elder Ray (13): | 0.90 | |
| Super Trend (3,10): | 56.68 | |
| Zig ZAG (10): | 58.30 | |
| VORTEX (21): | 1.1700 | |
| Stochastique (14,3,5): | 92.82 | |
| TEMA (21): | 58.06 | |
| Williams %R (14): | -12.24 | |
| Chande Momentum Oscillator (20): | 1.70 | |
| Repulse (5,40,3): | 0.9500 | |
| ROCnROLL: | 1 | |
| TRIX (15,9): | 0.0900 | |
| Courbe Coppock: | 3.95 |
| MA7: | 56.71 | |
| MA20: | 56.16 | |
| MA50: | 56.23 | |
| MA100: | 54.46 | |
| MAexp7: | 58.00 | |
| MAexp20: | 57.26 | |
| MAexp50: | 56.59 | |
| MAexp100: | 56.21 | |
| Price / MA7: | +2.72% | |
| Price / MA20: | +3.72% | |
| Price / MA50: | +3.59% | |
| Price / MA100: | +6.96% | |
| Price / MAexp7: | +0.43% | |
| Price / MAexp20: | +1.73% | |
| Price / MAexp50: | +2.93% | |
| Price / MAexp100: | +3.63% |
News
The last news published on FRAPORT AG FFM.AIRPORT at the time of the generation of this analysis was as follows:
- EQS-News: Fraport AG Frankfurt Airport Services Worldwide: Share Buyback for the Employee Participation Program
- EQS-News: Fraport AG Frankfurt Airport Services Worldwide: Share Buyback for the Employee Participation Program
- Fraport Group Interim Report - First Half 2022: Revenue Boosted by Rising Passenger Traffic
- DGAP-News: Fraport AG Frankfurt Airport Services Worldwide: Share Buyback for the Employee Participation Program
- Fraport Group Interim Release - First Quarter 2022: Key Operating Figures Improve Noticeably