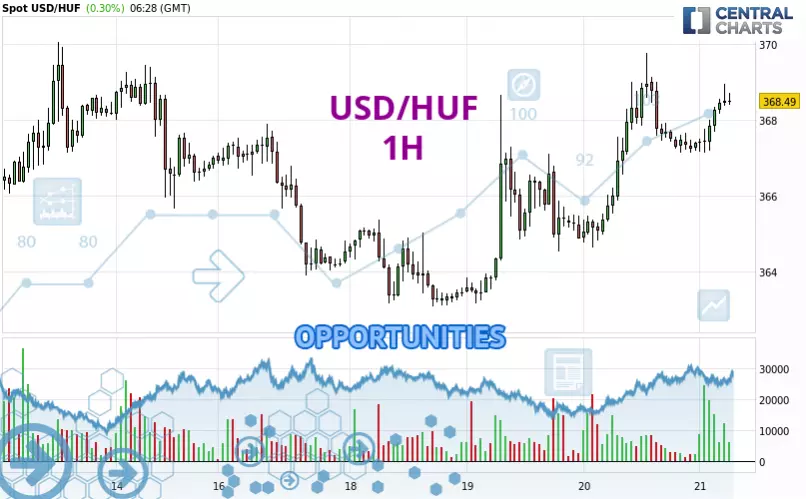
Londinia Opportunities Analyses - 03/21/2025 (GMT) USD/HUF - 1H
- FX/Indices
- Timeframe : 1H
- - Analysis generated on
- Status : INVALID
Summary of the analysis

Additional analysis
Quotes
USD/HUF rating 368.45 HUF. The price registered an increase of +0.29% on the session with the lowest point at 367.13 HUF and the highest point at 368.93 HUF. The deviation from the price is +0.36% for the low point and -0.13% for the high point.The Central Gaps scanner detects a bearish opening. A small advantage for sellers in the very short term.
Bearish opening
Type : Bearish
Timeframe : Openning
So that you have an overall view of the price change, here is a table showing the variations over several periods:
Near a new LOW record (1 year)
Type : Bearish
Timeframe : Weekly
Near a new LOW record (1st january)
Type : Bearish
Timeframe : Weekly
Near a new LOW record (1 month)
Type : Bearish
Timeframe : Weekly
Technical
Technical analysis of this 1H chart of USD/HUF indicates that the overall trend is strongly bullish. The signals given by the moving averages are 92.86% bullish. This strong bullish trend is confirmed by the strong signals currently being given by short-term moving averages. There is no crossing of moving average by the price or crossing of moving averages between themselves.
The probability of a further increase is high given the direction of the technical indicators.
Other results related to technical indicators were also found by the Central Indicators scanner:
Aroon indicator bullish trend
Type : Bullish
Timeframe : 1 hour
Price is back over the pivot point (Daily)
Type : Bullish
Timeframe : Weekly
The Central Patterns scanner, which studies chart patterns, resistances and supports, has identified this signal:
Near resistance of triangle
Type : Bearish
Timeframe : 1 hour
The presence of these Japanese chandelier patterns detected by Central Candlesticks that could impact the current short-term trend were also noted:
Bearish harami
Type : Bearish
Timeframe : 1 hour
Doji
Type : Neutral
Timeframe : 1 hour
| S3 | S2 | S1 | Price | R1 | R2 | R3 | |
|---|---|---|---|---|---|---|---|
| ProTrendLines | 365.65 | 367.26 | 367.86 | 368.45 | 368.64 | 370.04 | 372.67 |
| Change (%) | -0.76% | -0.32% | -0.16% | - | +0.05% | +0.43% | +1.15% |
| Change | -2.80 | -1.19 | -0.59 | - | +0.19 | +1.59 | +4.22 |
| Level | Intermediate | Intermediate | Minor | - | Intermediate | Intermediate | Intermediate |
To determine price objectives, it is also possible to use the pivot points. Here is the price position in relation to pivot points:
| Pivot points | S3 | S2 | S1 | PP | R1 | R2 | R3 |
|---|---|---|---|---|---|---|---|
| Standard | 359.68 | 362.16 | 364.78 | 367.26 | 369.88 | 372.36 | 374.98 |
| Camarilla | 366.00 | 366.47 | 366.93 | 367.40 | 367.87 | 368.34 | 368.80 |
| Woodie | 359.75 | 362.20 | 364.85 | 367.30 | 369.95 | 372.40 | 375.05 |
| Fibonacci | 362.16 | 364.11 | 365.31 | 367.26 | 369.21 | 370.41 | 372.36 |
| Pivot points | S3 | S2 | S1 | PP | R1 | R2 | R3 |
|---|---|---|---|---|---|---|---|
| Standard | 359.68 | 362.46 | 364.72 | 367.50 | 369.76 | 372.54 | 374.80 |
| Camarilla | 365.60 | 366.07 | 366.53 | 366.99 | 367.45 | 367.91 | 368.38 |
| Woodie | 359.43 | 362.33 | 364.47 | 367.37 | 369.51 | 372.41 | 374.55 |
| Fibonacci | 362.46 | 364.38 | 365.57 | 367.50 | 369.42 | 370.61 | 372.54 |
| Pivot points | S3 | S2 | S1 | PP | R1 | R2 | R3 |
|---|---|---|---|---|---|---|---|
| Standard | 357.04 | 368.05 | 378.67 | 389.68 | 400.30 | 411.31 | 421.93 |
| Camarilla | 383.33 | 385.32 | 387.30 | 389.28 | 391.26 | 393.25 | 395.23 |
| Woodie | 356.84 | 367.95 | 378.47 | 389.58 | 400.10 | 411.21 | 421.73 |
| Fibonacci | 368.05 | 376.32 | 381.42 | 389.68 | 397.95 | 403.05 | 411.31 |
Numerical data
The following are the details of the technical indicators and moving averages that were collected to generate this technical analysis:
| RSI (14): | 66.93 | |
| MACD (12,26,9): | 0.4700 | |
| Directional Movement: | 19.62 | |
| AROON (14): | 64.29 | |
| DEMA (21): | 368.34 | |
| Parabolic SAR (0,02-0,02-0,2): | 369.26 | |
| Elder Ray (13): | 0.62 | |
| Super Trend (3,10): | 366.86 | |
| Zig ZAG (10): | 368.49 | |
| VORTEX (21): | 1.1000 | |
| Stochastique (14,3,5): | 73.69 | |
| TEMA (21): | 368.32 | |
| Williams %R (14): | -23.76 | |
| Chande Momentum Oscillator (20): | 1.01 | |
| Repulse (5,40,3): | 0.0500 | |
| ROCnROLL: | 1 | |
| TRIX (15,9): | 0.0200 | |
| Courbe Coppock: | 0.03 |
| MA7: | 366.27 | |
| MA20: | 372.60 | |
| MA50: | 384.05 | |
| MA100: | 387.51 | |
| MAexp7: | 368.15 | |
| MAexp20: | 367.70 | |
| MAexp50: | 366.85 | |
| MAexp100: | 366.45 | |
| Price / MA7: | +0.60% | |
| Price / MA20: | -1.11% | |
| Price / MA50: | -4.06% | |
| Price / MA100: | -4.92% | |
| Price / MAexp7: | +0.08% | |
| Price / MAexp20: | +0.20% | |
| Price / MAexp50: | +0.43% | |
| Price / MAexp100: | +0.54% |
News
Don't forget to follow the news on USD/HUF. At the time of publication of this analysis, the latest news was as follows: