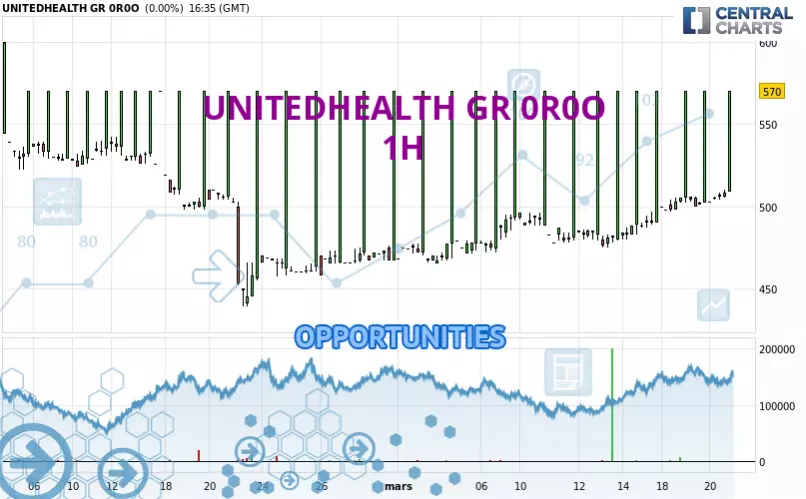
Londinia Opportunities Analyses - 03/20/2025 (GMT) UNITEDHEALTH GR 0R0O - 1H
| Type: | Stocks |
| Ticker: | 0R0O |
| ISIN: |
- Europe Stocks
- Timeframe : 1H
- - Analysis generated on
- Status : INVALID
Summary of the analysis

Additional analysis
Quotes
The UNITEDHEALTH GR 0R0O rating is 570 USD. The price registered an increase of +0.00% on the session with the lowest point at 503 USD and the highest point at 570 USD. The deviation from the price is +13.27% for the low point and 0% for the high point.The Central Gaps scanner detects a bearish opening. A small advantage for sellers in the very short term.
Bearish opening
Type : Bearish
Timeframe : Openning
A study of price movements over other periods shows the following variations:
Technical
Technical analysis of UNITEDHEALTH GR 0R0O in 1H shows a strongly overall bullish trend. 92.86% of the signals given by moving averages are bullish. The overall trend is supported by the strong bullish signals from short-term moving averages. The Central Indicators scanner detects bullish signals on moving averages that could impact this trend:
Bullish price crossover with Moving Average 20
Type : Bullish
Timeframe : 1 hour
Bullish price crossover with adaptative moving average 20
Type : Bullish
Timeframe : 1 hour
Bullish price crossover with adaptative moving average 50
Type : Bullish
Timeframe : 1 hour
Bullish price crossover with adaptative moving average 100
Type : Bullish
Timeframe : 1 hour
An assessment of technical indicators shows a moderate bullish signal.
But beware of excesses. The Central Indicators scanner currently detects this:
Williams %R indicator is overbought : over -20
Type : Neutral
Timeframe : 1 hour
MACD crosses UP its Moving Average
Type : Bullish
Timeframe : 1 hour
Price is back over the pivot point (Daily)
Type : Bullish
Timeframe : 1 hour
Price is back over the pivot point (Daily)
Type : Bullish
Timeframe : Weekly
Price is back over the pivot point (Weekly)
Type : Bullish
Timeframe : 1 hour
Price is back over the pivot point (Monthly)
Type : Bullish
Timeframe : 1 hour
An analysis of the price chart with the Central Patterns scanner (detector of chart patterns and resistances and supports) shows a result that can have an impact on the price change:
Near horizontal resistance
Type : Bearish
Timeframe : 1 hour
No result was found by the Central Candlesticks scanner on Japanese candlesticks.
| S3 | S2 | S1 | Price | R1 | R2 | R3 | |
|---|---|---|---|---|---|---|---|
| ProTrendLines | 523 | 552 | 562 | 570 | 572 | 583 | 600 |
| Change (%) | -8.25% | -3.16% | -1.40% | - | +0.35% | +2.28% | +5.26% |
| Change | -47 | -18 | -8 | - | +2 | +13 | +30 |
| Level | Minor | Intermediate | Minor | - | Minor | Major | Intermediate |
Attention could also be paid to pivot points to set price objectives:
| Pivot points | S3 | S2 | S1 | PP | R1 | R2 | R3 |
|---|---|---|---|---|---|---|---|
| Standard | 453 | 477 | 523 | 547 | 593 | 617 | 663 |
| Camarilla | 551 | 557 | 564 | 570 | 576 | 583 | 589 |
| Woodie | 465 | 483 | 535 | 553 | 605 | 623 | 675 |
| Fibonacci | 477 | 503 | 520 | 547 | 573 | 590 | 617 |
| Pivot points | S3 | S2 | S1 | PP | R1 | R2 | R3 |
|---|---|---|---|---|---|---|---|
| Standard | 412 | 443 | 507 | 538 | 602 | 633 | 697 |
| Camarilla | 544 | 553 | 561 | 570 | 579 | 587 | 596 |
| Woodie | 428 | 451 | 523 | 546 | 618 | 641 | 713 |
| Fibonacci | 443 | 480 | 502 | 538 | 575 | 597 | 633 |
| Pivot points | S3 | S2 | S1 | PP | R1 | R2 | R3 |
|---|---|---|---|---|---|---|---|
| Standard | 310 | 374 | 472 | 536 | 634 | 698 | 796 |
| Camarilla | 525 | 540 | 555 | 570 | 585 | 600 | 615 |
| Woodie | 327 | 383 | 489 | 545 | 651 | 707 | 813 |
| Fibonacci | 374 | 436 | 474 | 536 | 598 | 636 | 698 |
Numerical data
The following is the status of the technical indicators and moving averages at the time of publication of this technical analysis:
| RSI (14): | 57.00 | |
| MACD (12,26,9): | 7.0000 | |
| Directional Movement: | 51 | |
| AROON (14): | 22 | |
| DEMA (21): | 525 | |
| Parabolic SAR (0,02-0,02-0,2): | 504 | |
| Elder Ray (13): | 19 | |
| Super Trend (3,10): | 441 | |
| Zig ZAG (10): | 570 | |
| VORTEX (21): | 1.0000 | |
| Stochastique (14,3,5): | 46.00 | |
| TEMA (21): | 529 | |
| Williams %R (14): | 0.00 | |
| Chande Momentum Oscillator (20): | 72 | |
| Repulse (5,40,3): | 17.0000 | |
| ROCnROLL: | 1 | |
| TRIX (15,9): | 0.0000 | |
| Courbe Coppock: | 6.00 |
| MA7: | 570 | |
| MA20: | 570 | |
| MA50: | 570 | |
| MA100: | 569 | |
| MAexp7: | 527 | |
| MAexp20: | 518 | |
| MAexp50: | 510 | |
| MAexp100: | 508 | |
| Price / MA7: | -0% | |
| Price / MA20: | -0% | |
| Price / MA50: | -0% | |
| Price / MA100: | +0.18% | |
| Price / MAexp7: | +8.16% | |
| Price / MAexp20: | +10.04% | |
| Price / MAexp50: | +11.76% | |
| Price / MAexp100: | +12.20% |