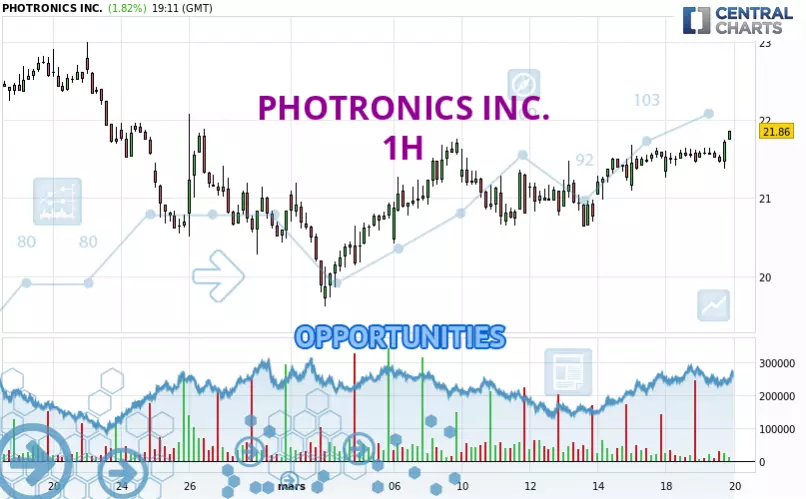
Londinia Opportunities Analyses - 03/19/2025 (GMT) PHOTRONICS INC. - 1H
- U.S. Stocks
- Timeframe : 1H
- - Analysis generated on
- Status : INVALID
Summary of the analysis

Additional analysis
Quotes
The PHOTRONICS INC. rating is 21.83 USD. The price has increased by +1.68% since the last closing and was between 21.38 USD and 21.83 USD. This implies that the price is at +2.10% from its lowest and at 0% from its highest.A bullish opening was detected by the Central Gaps scanner. Buyers are trying to impose a bullish momentum in the very short term.
Bullish opening
Type : Bullish
Timeframe : Openning
So that you have an overall view of the price change, here is a table showing the variations over several periods:
Technical
Technical analysis of PHOTRONICS INC. in 1H shows a strongly overall bullish trend. 92.86% of the signals given by moving averages are bullish. The overall trend is supported by the strong bullish signals from short-term moving averages. An assessment of moving averages reveals a bullish signal that could impact this trend:
Bullish price crossover with Moving Average 20
Type : Bullish
Timeframe : 1 hour
In fact, 15 technical indicators on 18 studied are currently positioned bullish. But beware of excesses. The Central Indicators scanner currently detects this:
Williams %R indicator is overbought : over -20
Type : Neutral
Timeframe : 1 hour
Pivot points : price is over resistance 1 (Daily)
Type : Neutral
Timeframe : 1 hour
Aroon indicator bullish trend
Type : Bullish
Timeframe : 1 hour
SuperTrend indicator bullish reversal
Type : Bullish
Timeframe : 1 hour
Price is back over the pivot point (Daily)
Type : Bullish
Timeframe : Weekly
Momentum indicator is back over 0
Type : Bullish
Timeframe : 1 hour
Pivot points : price is over resistance 1 (Monthly)
Type : Neutral
Timeframe : 1 hour
The Central Patterns scanner, which studies chart patterns, resistances and supports, has identified this signal:
Near resistance of channel
Type : Bearish
Timeframe : 1 hour
Central Candlesticks, the scanner specialised in Japanese candlesticks, detects a bearish signal that could support the hypothesis of a small drop in the very short term:
Bearish doji star
Type : Bearish
Timeframe : 1 hour
| S3 | S2 | S1 | Price | R1 | R2 | R3 | |
|---|---|---|---|---|---|---|---|
| ProTrendLines | 20.78 | 21.27 | 21.67 | 21.83 | 22.10 | 22.40 | 22.83 |
| Change (%) | -4.81% | -2.57% | -0.73% | - | +1.24% | +2.61% | +4.58% |
| Change | -1.05 | -0.56 | -0.16 | - | +0.27 | +0.57 | +1.00 |
| Level | Major | Minor | Minor | - | Intermediate | Minor | Major |
Pivot points can also be used to set your price objectives. Here is the price situation in relation to pivot points:
| Pivot points | S3 | S2 | S1 | PP | R1 | R2 | R3 |
|---|---|---|---|---|---|---|---|
| Standard | 20.89 | 21.08 | 21.27 | 21.46 | 21.65 | 21.84 | 22.03 |
| Camarilla | 21.37 | 21.40 | 21.44 | 21.47 | 21.51 | 21.54 | 21.58 |
| Woodie | 20.90 | 21.08 | 21.28 | 21.46 | 21.66 | 21.84 | 22.04 |
| Fibonacci | 21.08 | 21.22 | 21.31 | 21.46 | 21.60 | 21.69 | 21.84 |
| Pivot points | S3 | S2 | S1 | PP | R1 | R2 | R3 |
|---|---|---|---|---|---|---|---|
| Standard | 19.70 | 20.16 | 20.71 | 21.17 | 21.72 | 22.18 | 22.73 |
| Camarilla | 20.98 | 21.08 | 21.17 | 21.26 | 21.35 | 21.45 | 21.54 |
| Woodie | 19.75 | 20.18 | 20.76 | 21.19 | 21.77 | 22.20 | 22.78 |
| Fibonacci | 20.16 | 20.55 | 20.78 | 21.17 | 21.56 | 21.79 | 22.18 |
| Pivot points | S3 | S2 | S1 | PP | R1 | R2 | R3 |
|---|---|---|---|---|---|---|---|
| Standard | 16.79 | 18.53 | 19.69 | 21.43 | 22.59 | 24.33 | 25.49 |
| Camarilla | 20.04 | 20.31 | 20.57 | 20.84 | 21.11 | 21.37 | 21.64 |
| Woodie | 16.49 | 18.39 | 19.39 | 21.29 | 22.29 | 24.19 | 25.19 |
| Fibonacci | 18.53 | 19.64 | 20.33 | 21.43 | 22.54 | 23.23 | 24.33 |
Numerical data
The following is the status of the technical indicators and moving averages at the time of publication of this technical analysis:
| RSI (14): | 61.07 | |
| MACD (12,26,9): | 0.1000 | |
| Directional Movement: | 4.71 | |
| AROON (14): | 85.72 | |
| DEMA (21): | 21.66 | |
| Parabolic SAR (0,02-0,02-0,2): | 21.26 | |
| Elder Ray (13): | 0.18 | |
| Super Trend (3,10): | 21.28 | |
| Zig ZAG (10): | 21.80 | |
| VORTEX (21): | 1.1200 | |
| Stochastique (14,3,5): | 82.26 | |
| TEMA (21): | 21.68 | |
| Williams %R (14): | -1.85 | |
| Chande Momentum Oscillator (20): | 0.27 | |
| Repulse (5,40,3): | 0.9900 | |
| ROCnROLL: | 1 | |
| TRIX (15,9): | 0.0700 | |
| Courbe Coppock: | 0.94 |
| MA7: | 21.21 | |
| MA20: | 21.10 | |
| MA50: | 22.36 | |
| MA100: | 23.49 | |
| MAexp7: | 21.63 | |
| MAexp20: | 21.50 | |
| MAexp50: | 21.33 | |
| MAexp100: | 21.30 | |
| Price / MA7: | +2.92% | |
| Price / MA20: | +3.46% | |
| Price / MA50: | -2.37% | |
| Price / MA100: | -7.07% | |
| Price / MAexp7: | +0.92% | |
| Price / MAexp20: | +1.53% | |
| Price / MAexp50: | +2.34% | |
| Price / MAexp100: | +2.49% |
News
Don't forget to follow the news on PHOTRONICS INC.. At the time of publication of this analysis, the latest news was as follows:
- SHAREHOLDER ALERT: Purcell & Lefkowitz LLP Announces Shareholder Investigation of Photronics, Inc. (NASDAQ: PLAB)
- SHAREHOLDER ALERT: Purcell & Lefkowitz LLP Is Investigating Photronics, Inc. for Potential Breaches of Fiduciary Duty By Its Board of Directors
-
 Photronics, Inc. - PLAB Stock Chart Technical Analysis for 07-23-2019
- Photronics, Inc. to Host Earnings Call
- Photronics, Inc. to Host Earnings Call