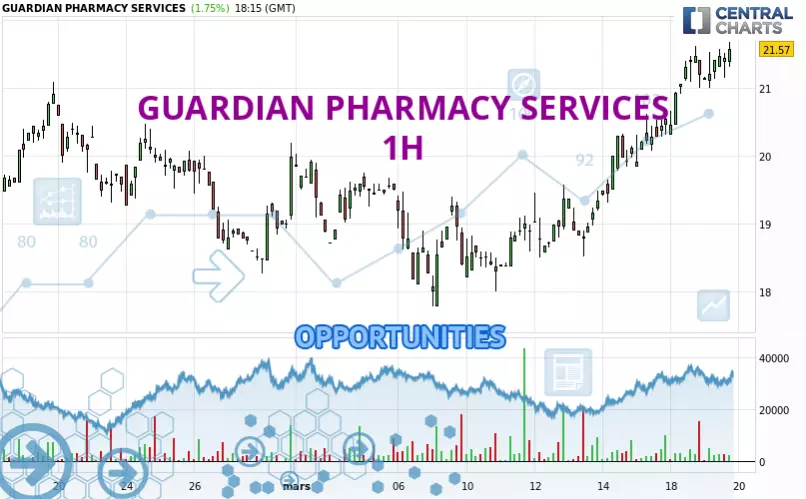
Londinia Opportunities Analyses - 03/19/2025 (GMT) GUARDIAN PHARMACY SERVICES - 1H
- U.S. Stocks
- Timeframe : 1H
- - Analysis generated on
- Status : INVALID
Summary of the analysis

Additional analysis
Quotes
GUARDIAN PHARMACY SERVICES rating 21.57 USD. The price registered an increase of +1.75% on the session and was traded between 20.99 USD and 21.57 USD over the period. The price is currently at +2.76% from its lowest and 0% from its highest.A bearish opening was detected by the Central Gaps scanner. Sellers are trying to impose a bearish trend in the very short term.
Bearish opening
Type : Bearish
Timeframe : Openning
So that you have an overall view of the price change, here is a table showing the variations over several periods:
New HIGH record (1 month)
Type : Bullish
Timeframe : Weekly
Near a new HIGH record (1 month)
Type : Bullish
Timeframe : Weekly
Technical
Technical analysis of this 1H chart of GUARDIAN PHARMACY SERVICES indicates that the overall trend is strongly bullish. 92.86% of the signals given by moving averages are bullish. The overall trend is supported by the strong bullish signals from short-term moving averages. There is no crossing of moving average by the price or crossing of moving averages between themselves.
The probability of a further increase is high given the direction of the technical indicators.
But beware of excesses. The Central Indicators scanner currently detects this:
Williams %R indicator is overbought : over -20
Type : Neutral
Timeframe : 1 hour
Pivot points : price is over resistance 1 (Daily)
Type : Neutral
Timeframe : Weekly
MACD crosses DOWN its Moving Average
Type : Bearish
Timeframe : 1 hour
Pivot points : price is over resistance 1 (Weekly)
Type : Neutral
Timeframe : 1 hour
Pivot points : price is over resistance 1 (Monthly)
Type : Neutral
Timeframe : 1 hour
Central Patterns, the scanner specializing in chart patterns, did not identify any signals.
No result was found by the Central Candlesticks scanner on Japanese candlesticks.
| S3 | S2 | S1 | Price | R1 | R2 | R3 | |
|---|---|---|---|---|---|---|---|
| ProTrendLines | 19.44 | 20.62 | 21.26 | 21.57 | 22.25 | 23.11 | 24.28 |
| Change (%) | -9.87% | -4.40% | -1.44% | - | +3.15% | +7.14% | +12.56% |
| Change | -2.13 | -0.95 | -0.31 | - | +0.68 | +1.54 | +2.71 |
| Level | Major | Intermediate | Intermediate | - | Minor | Major | Minor |
Pivot points can also be used to set your price objectives. Here is the price situation in relation to pivot points:
| Pivot points | S3 | S2 | S1 | PP | R1 | R2 | R3 |
|---|---|---|---|---|---|---|---|
| Standard | 19.15 | 19.73 | 20.46 | 21.04 | 21.77 | 22.35 | 23.08 |
| Camarilla | 20.84 | 20.96 | 21.08 | 21.20 | 21.32 | 21.44 | 21.56 |
| Woodie | 19.24 | 19.77 | 20.55 | 21.08 | 21.86 | 22.39 | 23.17 |
| Fibonacci | 19.73 | 20.23 | 20.54 | 21.04 | 21.54 | 21.85 | 22.35 |
| Pivot points | S3 | S2 | S1 | PP | R1 | R2 | R3 |
|---|---|---|---|---|---|---|---|
| Standard | 16.30 | 17.15 | 18.62 | 19.47 | 20.94 | 21.79 | 23.26 |
| Camarilla | 19.45 | 19.67 | 19.88 | 20.09 | 20.30 | 20.52 | 20.73 |
| Woodie | 16.61 | 17.31 | 18.93 | 19.63 | 21.25 | 21.95 | 23.57 |
| Fibonacci | 17.15 | 18.04 | 18.58 | 19.47 | 20.36 | 20.90 | 21.79 |
| Pivot points | S3 | S2 | S1 | PP | R1 | R2 | R3 |
|---|---|---|---|---|---|---|---|
| Standard | 12.77 | 15.52 | 17.76 | 20.51 | 22.75 | 25.50 | 27.74 |
| Camarilla | 18.63 | 19.09 | 19.54 | 20.00 | 20.46 | 20.92 | 21.37 |
| Woodie | 12.52 | 15.39 | 17.51 | 20.38 | 22.50 | 25.37 | 27.49 |
| Fibonacci | 15.52 | 17.43 | 18.60 | 20.51 | 22.42 | 23.59 | 25.50 |
Numerical data
The following are the details of the technical indicators and moving averages that were collected to generate this technical analysis:
| RSI (14): | 70.15 | |
| MACD (12,26,9): | 0.5300 | |
| Directional Movement: | 20.77 | |
| AROON (14): | 85.72 | |
| DEMA (21): | 21.19 | |
| Parabolic SAR (0,02-0,02-0,2): | 20.96 | |
| Elder Ray (13): | 0.39 | |
| Super Trend (3,10): | 20.51 | |
| Zig ZAG (10): | 21.19 | |
| VORTEX (21): | 1.1800 | |
| Stochastique (14,3,5): | 87.88 | |
| TEMA (21): | 21.45 | |
| Williams %R (14): | -30.74 | |
| Chande Momentum Oscillator (20): | 0.92 | |
| Repulse (5,40,3): | 0.3900 | |
| ROCnROLL: | 1 | |
| TRIX (15,9): | 0.3500 | |
| Courbe Coppock: | 11.40 |
| MA7: | 20.08 | |
| MA20: | 19.51 | |
| MA50: | 20.44 | |
| MA100: | 21.01 | |
| MAexp7: | 21.10 | |
| MAexp20: | 20.52 | |
| MAexp50: | 19.86 | |
| MAexp100: | 19.66 | |
| Price / MA7: | +7.42% | |
| Price / MA20: | +10.56% | |
| Price / MA50: | +5.53% | |
| Price / MA100: | +2.67% | |
| Price / MAexp7: | +2.23% | |
| Price / MAexp20: | +5.12% | |
| Price / MAexp50: | +8.61% | |
| Price / MAexp100: | +9.72% |