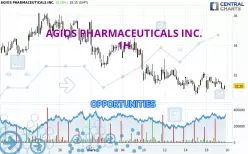
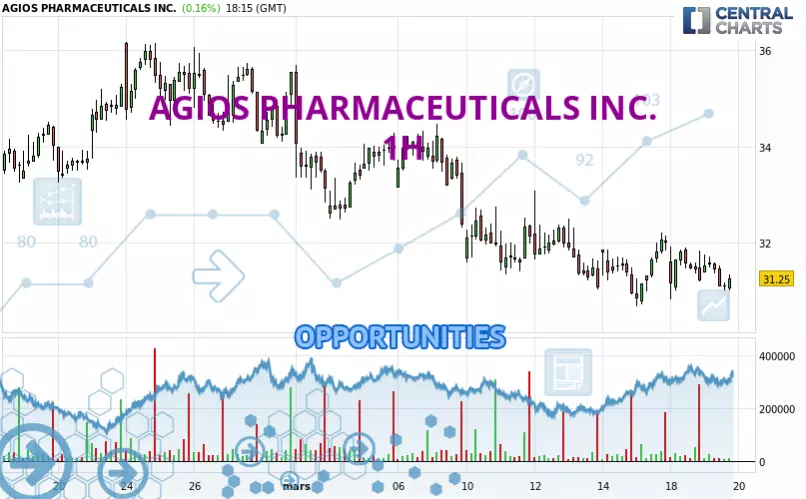
Londinia Opportunities Analyses - 03/19/2025 (GMT) AGIOS PHARMACEUTICALS INC. - 1H
- U.S. Stocks
- Timeframe : 1H
- - Analysis generated on
- Status : INVALID
Summary of the analysis
Additional analysis
Quotes
AGIOS PHARMACEUTICALS INC. rating 31.21 USD. The price has increased by +0.03% since the last closing with the lowest point at 31.00 USD and the highest point at 31.74 USD. The deviation from the price is +0.68% for the low point and -1.67% for the high point.The Central Gaps scanner detects a bullish opening. A small advantage for buyers in the very short term.
Bullish opening
Type : Bullish
Timeframe : Openning
A study of price movements over other periods shows the following variations:
Near a new LOW record (1st january)
Type : Bearish
Timeframe : Weekly
Near a new LOW record (1 month)
Type : Bearish
Timeframe : Weekly
Technical
A technical analysis in 1H of this AGIOS PHARMACEUTICALS INC. chart shows a sharp bearish trend. The signals given by moving averages are 92.86% bearish. This strong bearish trend is confirmed by the strong signals currently being given by short-term moving averages. The Central Indicators market scanner currently does not detect any result that concerns moving averages.
Technical indicators are bearish. There is still some doubt about the decline in the price.
Caution: the Central Indicators scanner currently detects an excess:
CCI indicator is oversold : under -100
Type : Neutral
Timeframe : 1 hour
Williams %R indicator is oversold : under -80
Type : Neutral
Timeframe : 1 hour
No signals are given by Central Patterns, a market scanner specialised in chart patterns, resistances and supports.
Central Candlesticks, the scanner specialised in Japanese candlesticks, detects these signals that could have an impact on the current short-term trend:
Black hanging man / hammer
Type : Neutral
Timeframe : 1 hour
Three black crows
Type : Bearish
Timeframe : 1 hour
| S3 | S2 | S1 | Price | R1 | R2 | R3 | |
|---|---|---|---|---|---|---|---|
| ProTrendLines | 19.97 | 30.24 | 30.67 | 31.21 | 31.56 | 32.48 | 34.45 |
| Change (%) | -36.01% | -3.11% | -1.73% | - | +1.12% | +4.07% | +10.38% |
| Change | -11.24 | -0.97 | -0.54 | - | +0.35 | +1.27 | +3.24 |
| Level | Major | Major | Intermediate | - | Minor | Minor | Intermediate |
Pivot points can also be used to set your price objectives. Here is the price situation in relation to pivot points:
| Pivot points | S3 | S2 | S1 | PP | R1 | R2 | R3 |
|---|---|---|---|---|---|---|---|
| Standard | 29.59 | 30.20 | 30.70 | 31.31 | 31.81 | 32.42 | 32.92 |
| Camarilla | 30.90 | 31.00 | 31.10 | 31.20 | 31.30 | 31.40 | 31.51 |
| Woodie | 29.54 | 30.17 | 30.65 | 31.28 | 31.76 | 32.39 | 32.87 |
| Fibonacci | 30.20 | 30.62 | 30.89 | 31.31 | 31.73 | 32.00 | 32.42 |
| Pivot points | S3 | S2 | S1 | PP | R1 | R2 | R3 |
|---|---|---|---|---|---|---|---|
| Standard | 28.04 | 29.48 | 30.20 | 31.64 | 32.36 | 33.80 | 34.52 |
| Camarilla | 30.34 | 30.53 | 30.73 | 30.93 | 31.13 | 31.33 | 31.52 |
| Woodie | 27.69 | 29.30 | 29.85 | 31.46 | 32.01 | 33.62 | 34.17 |
| Fibonacci | 29.48 | 30.30 | 30.81 | 31.64 | 32.46 | 32.97 | 33.80 |
| Pivot points | S3 | S2 | S1 | PP | R1 | R2 | R3 |
|---|---|---|---|---|---|---|---|
| Standard | 28.07 | 29.81 | 32.68 | 34.42 | 37.29 | 39.03 | 41.90 |
| Camarilla | 34.27 | 34.70 | 35.12 | 35.54 | 35.96 | 36.39 | 36.81 |
| Woodie | 28.63 | 30.09 | 33.24 | 34.70 | 37.85 | 39.31 | 42.46 |
| Fibonacci | 29.81 | 31.57 | 32.66 | 34.42 | 36.18 | 37.27 | 39.03 |
Numerical data
The following are the details of the technical indicators and moving averages that were collected to generate this technical analysis:
| RSI (14): | 41.56 | |
| MACD (12,26,9): | -0.1200 | |
| Directional Movement: | -9.23 | |
| AROON (14): | -14.29 | |
| DEMA (21): | 31.29 | |
| Parabolic SAR (0,02-0,02-0,2): | 31.92 | |
| Elder Ray (13): | -0.31 | |
| Super Trend (3,10): | 32.28 | |
| Zig ZAG (10): | 31.06 | |
| VORTEX (21): | 0.9300 | |
| Stochastique (14,3,5): | 26.98 | |
| TEMA (21): | 31.34 | |
| Williams %R (14): | -84.17 | |
| Chande Momentum Oscillator (20): | -0.96 | |
| Repulse (5,40,3): | -1.8600 | |
| ROCnROLL: | 2 | |
| TRIX (15,9): | -0.0400 | |
| Courbe Coppock: | 0.78 |
| MA7: | 31.48 | |
| MA20: | 33.15 | |
| MA50: | 33.55 | |
| MA100: | 40.68 | |
| MAexp7: | 31.31 | |
| MAexp20: | 31.44 | |
| MAexp50: | 31.80 | |
| MAexp100: | 32.41 | |
| Price / MA7: | -0.86% | |
| Price / MA20: | -5.85% | |
| Price / MA50: | -6.97% | |
| Price / MA100: | -23.28% | |
| Price / MAexp7: | -0.32% | |
| Price / MAexp20: | -0.73% | |
| Price / MAexp50: | -1.86% | |
| Price / MAexp100: | -3.70% |
News
Don't forget to follow the news on AGIOS PHARMACEUTICALS INC.. At the time of publication of this analysis, the latest news was as follows:
- Thinking about buying stock in Agios Pharmaceuticals, Clovis Oncology, Aqua Metals, Cocrystal Pharma, or Luminar Technologies?
- Servier to Acquire Agios Pharmaceuticals' Oncology Business
- Servier to Acquire Agios Pharmaceuticals' Oncology Business
- Market Trends Toward New Normal in Agios Pharmaceuticals, Corcept Therapeutics, Prestige Brand, Virtu Financial, Eagle Pharmaceuticals, and Century Aluminum — Emerging Consolidated Expectations, Analyst Ratings
- Agios Pharmaceuticals, Inc. to Host Earnings Call