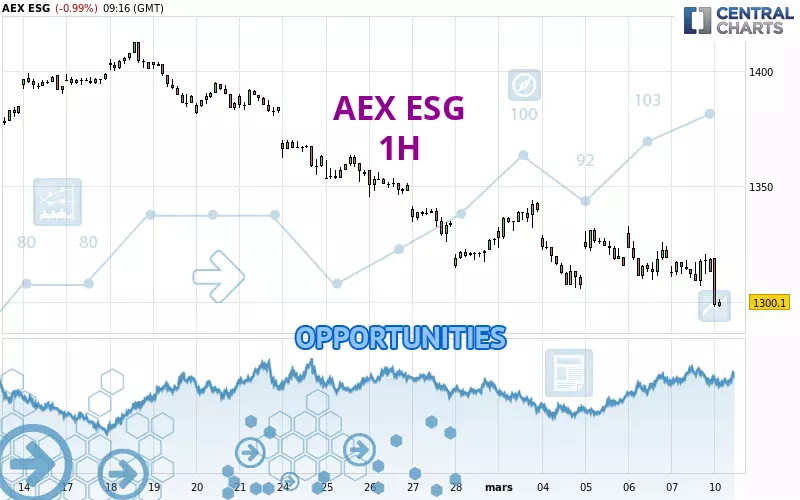
Londinia Opportunities Analyses - 03/10/2025 (GMT) AEX ESG - 1H
| Type: | Indices |
| Ticker: | AESGP |
| ISIN: | NLESG0000014 |
- FX/Indices
- Timeframe : 1H
- - Analysis generated on
- Status : TARGET REACHED
Summary of the analysis

Additional analysis
Quotes
The AEX ESG price is 1,299.24 EUR. The price registered a decrease of -1.05% on the session and was between 1,297.80 EUR and 1,318.93 EUR. This implies that the price is at +0.11% from its lowest and at -1.49% from its highest.A bullish opening was detected by the Central Gaps scanner. Buyers are trying to impose a bullish momentum in the very short term.
Bullish opening
Type : Bullish
Timeframe : Openning
Here is a more detailed summary of the historical variations registered by AEX ESG:
Near a new LOW record (1st january)
Type : Bearish
Timeframe : Weekly
New LOW record (1 month)
Type : Bearish
Timeframe : Weekly
Technical
Technical analysis of this 1H chart of AEX ESG indicates that the overall trend is strongly bearish. 92.86% of the signals given by moving averages are bearish. The overall trend is supported by the strong bearish signals from short-term moving averages. The Central Indicators market scanner currently does not detect any result that concerns moving averages.
In fact, according to the parameters integrated into the Central Analyzer system, 14 technical indicators out of 18 analysed are currently bearish. Caution: the Central Indicators scanner currently detects an excess:
CCI indicator is oversold : under -100
Type : Neutral
Timeframe : 1 hour
Previous candle closed under Bollinger bands
Type : Neutral
Timeframe : 1 hour
Williams %R indicator is oversold : under -80
Type : Neutral
Timeframe : 1 hour
Pivot points : price is under support 2
Type : Neutral
Timeframe : 1 hour
The analysis of the price chart with Central Patterns scanners does not return any result.
The Central Candlesticks scanner, specialised in Japanese candlesticks, did not identify any signals.
| S3 | S2 | S1 | Price | R1 | R2 | R3 | |
|---|---|---|---|---|---|---|---|
| ProTrendLines | 1,189.17 | 1,246.94 | 1,292.19 | 1,299.24 | 1,305.74 | 1,324.52 | 1,333.33 |
| Change (%) | -8.47% | -4.03% | -0.54% | - | +0.50% | +1.95% | +2.62% |
| Change | -110.07 | -52.30 | -7.05 | - | +6.50 | +25.28 | +34.09 |
| Level | Major | Minor | Major | - | Intermediate | Intermediate | Major |
Pivot points can also be used to set your price objectives. Here is the price situation in relation to pivot points:
| Pivot points | S3 | S2 | S1 | PP | R1 | R2 | R3 |
|---|---|---|---|---|---|---|---|
| Standard | 1,292.71 | 1,299.79 | 1,306.42 | 1,313.50 | 1,320.13 | 1,327.21 | 1,333.84 |
| Camarilla | 1,309.27 | 1,310.53 | 1,311.78 | 1,313.04 | 1,314.30 | 1,315.55 | 1,316.81 |
| Woodie | 1,292.48 | 1,299.68 | 1,306.19 | 1,313.39 | 1,319.90 | 1,327.10 | 1,333.61 |
| Fibonacci | 1,299.79 | 1,305.03 | 1,308.27 | 1,313.50 | 1,318.74 | 1,321.98 | 1,327.21 |
| Pivot points | S3 | S2 | S1 | PP | R1 | R2 | R3 |
|---|---|---|---|---|---|---|---|
| Standard | 1,259.70 | 1,282.72 | 1,297.88 | 1,320.90 | 1,336.06 | 1,359.08 | 1,374.24 |
| Camarilla | 1,302.54 | 1,306.04 | 1,309.54 | 1,313.04 | 1,316.54 | 1,320.04 | 1,323.54 |
| Woodie | 1,255.77 | 1,280.76 | 1,293.95 | 1,318.94 | 1,332.13 | 1,357.12 | 1,370.31 |
| Fibonacci | 1,282.72 | 1,297.31 | 1,306.32 | 1,320.90 | 1,335.49 | 1,344.50 | 1,359.08 |
| Pivot points | S3 | S2 | S1 | PP | R1 | R2 | R3 |
|---|---|---|---|---|---|---|---|
| Standard | 1,163.86 | 1,230.75 | 1,278.72 | 1,345.61 | 1,393.58 | 1,460.47 | 1,508.44 |
| Camarilla | 1,295.09 | 1,305.62 | 1,316.15 | 1,326.68 | 1,337.21 | 1,347.74 | 1,358.27 |
| Woodie | 1,154.39 | 1,226.02 | 1,269.25 | 1,340.88 | 1,384.11 | 1,455.74 | 1,498.97 |
| Fibonacci | 1,230.75 | 1,274.63 | 1,301.74 | 1,345.61 | 1,389.49 | 1,416.60 | 1,460.47 |
Numerical data
The following is the status of the technical indicators and moving averages at the time of publication of this technical analysis:
| RSI (14): | 36.48 | |
| MACD (12,26,9): | -4.1200 | |
| Directional Movement: | -14.76 | |
| AROON (14): | -78.57 | |
| DEMA (21): | 1,308.37 | |
| Parabolic SAR (0,02-0,02-0,2): | 1,320.13 | |
| Elder Ray (13): | -11.77 | |
| Super Trend (3,10): | 1,323.76 | |
| Zig ZAG (10): | 1,300.35 | |
| VORTEX (21): | 0.8500 | |
| Stochastique (14,3,5): | 15.78 | |
| TEMA (21): | 1,307.65 | |
| Williams %R (14): | -89.10 | |
| Chande Momentum Oscillator (20): | -21.39 | |
| Repulse (5,40,3): | -1.2100 | |
| ROCnROLL: | 2 | |
| TRIX (15,9): | -0.0300 | |
| Courbe Coppock: | 1.12 |
| MA7: | 1,317.25 | |
| MA20: | 1,353.17 | |
| MA50: | 1,317.27 | |
| MA100: | 1,281.68 | |
| MAexp7: | 1,307.91 | |
| MAexp20: | 1,313.33 | |
| MAexp50: | 1,321.36 | |
| MAexp100: | 1,332.65 | |
| Price / MA7: | -1.37% | |
| Price / MA20: | -3.99% | |
| Price / MA50: | -1.37% | |
| Price / MA100: | +1.37% | |
| Price / MAexp7: | -0.66% | |
| Price / MAexp20: | -1.07% | |
| Price / MAexp50: | -1.67% | |
| Price / MAexp100: | -2.51% |