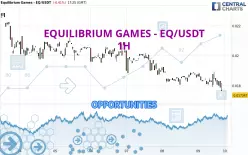
Londinia Opportunities Analyses - 03/09/2025 (GMT) EQUILIBRIUM GAMES - EQ/USDT - 1H
| Type: | Cryptocurrencies |
| Ticker: | EQUSDT |
| ISIN: |
- Cryptocurrencies
- Timeframe : 1H
- - Analysis generated on
- Status : TARGET REACHED
Summary of the analysis

Additional analysis
Quotes
The EQUILIBRIUM GAMES - EQ/USDT rating is 0.017347 USDT. On the day, this instrument lost -6.42% and was traded between 0.017347 USDT and 0.018920 USDT over the period. The price is currently at 0% from its lowest and -8.31% from its highest.The Central Gaps scanner detects a bearish opening. A small advantage for sellers in the very short term.
Bullish opening
Type : Bullish
Timeframe : Openning
Bearish opening
Type : Bearish
Timeframe : Openning
A study of price movements over other periods shows the following variations:
New LOW record (1 month)
Type : Bearish
Timeframe : Weekly
Technical
Technical analysis of this 1H chart of EQUILIBRIUM GAMES - EQ/USDT indicates that the overall trend is strongly bearish. The signals given by moving averages are 92.86% bearish. This strong bearish trend is confirmed by the strong signals currently being given by short-term moving averages. The Central Indicators market scanner currently does not detect any result that concerns moving averages.
In fact, according to the parameters integrated into the Central Analyzer system, 13 technical indicators out of 18 analysed are currently bearish. But beware of excesses. The Central Indicators scanner currently detects this:
CCI indicator is oversold : under -100
Type : Neutral
Timeframe : 1 hour
Williams %R indicator is oversold : under -80
Type : Neutral
Timeframe : 1 hour
Pivot points : price is under support 3
Type : Neutral
Timeframe : 1 hour
No signals are given by Central Patterns, a market scanner specialised in chart patterns, resistances and supports.
From the Japanese candlestick perspective, the Central Candlesticks scanner notes the presence of these results that could impact the short-term trend:
Black hanging man / hammer
Type : Neutral
Timeframe : 1 hour
Bullish harami cross
Type : Bullish
Timeframe : 1 hour
| S2 | S1 | Price | R1 | R2 | R3 | |
|---|---|---|---|---|---|---|
| ProTrendLines | 0.004033 | 0.009248 | 0.017347 | 0.018811 | 0.020228 | 0.020893 |
| Change (%) | -76.75% | -46.69% | - | +8.44% | +16.61% | +20.44% |
| Change | -0.013314 | -0.008099 | - | +0.001464 | +0.002881 | +0.003546 |
| Level | Minor | Intermediate | - | Intermediate | Major | Major |
To determine price objectives, it is also possible to use the pivot points. Here is the price position in relation to pivot points:
| Pivot points | S3 | S2 | S1 | PP | R1 | R2 | R3 |
|---|---|---|---|---|---|---|---|
| Standard | 0.016816 | 0.017440 | 0.017988 | 0.018612 | 0.019160 | 0.019784 | 0.020332 |
| Camarilla | 0.018214 | 0.018321 | 0.018429 | 0.018536 | 0.018643 | 0.018751 | 0.018858 |
| Woodie | 0.016778 | 0.017421 | 0.017950 | 0.018593 | 0.019122 | 0.019765 | 0.020294 |
| Fibonacci | 0.017440 | 0.017888 | 0.018164 | 0.018612 | 0.019060 | 0.019336 | 0.019784 |
| Pivot points | S3 | S2 | S1 | PP | R1 | R2 | R3 |
|---|---|---|---|---|---|---|---|
| Standard | 0.007355 | 0.012709 | 0.015623 | 0.020977 | 0.023891 | 0.029245 | 0.032159 |
| Camarilla | 0.016262 | 0.017020 | 0.017778 | 0.018536 | 0.019294 | 0.020052 | 0.020810 |
| Woodie | 0.006134 | 0.012099 | 0.014402 | 0.020367 | 0.022670 | 0.028635 | 0.030938 |
| Fibonacci | 0.012709 | 0.015868 | 0.017819 | 0.020977 | 0.024136 | 0.026087 | 0.029245 |
| Pivot points | S3 | S2 | S1 | PP | R1 | R2 | R3 |
|---|---|---|---|---|---|---|---|
| Standard | -0.004917 | 0.004969 | 0.012678 | 0.022564 | 0.030273 | 0.040159 | 0.047868 |
| Camarilla | 0.015548 | 0.017161 | 0.018774 | 0.020387 | 0.022000 | 0.023613 | 0.025226 |
| Woodie | -0.006006 | 0.004425 | 0.011590 | 0.022020 | 0.029185 | 0.039615 | 0.046780 |
| Fibonacci | 0.004969 | 0.011690 | 0.015843 | 0.022564 | 0.029285 | 0.033438 | 0.040159 |
Numerical data
The following are the details of the technical indicators and moving averages that were collected to generate this technical analysis:
| RSI (14): | 35.74 | |
| MACD (12,26,9): | -0.0002 | |
| Directional Movement: | -13.008048 | |
| AROON (14): | -35.714286 | |
| DEMA (21): | 0.018059 | |
| Parabolic SAR (0,02-0,02-0,2): | 0.018899 | |
| Elder Ray (13): | -0.000305 | |
| Super Trend (3,10): | 0.018830 | |
| Zig ZAG (10): | 0.017628 | |
| VORTEX (21): | 0.7689 | |
| Stochastique (14,3,5): | 12.14 | |
| TEMA (21): | 0.018027 | |
| Williams %R (14): | -100.00 | |
| Chande Momentum Oscillator (20): | -0.000733 | |
| Repulse (5,40,3): | -4.1482 | |
| ROCnROLL: | 2 | |
| TRIX (15,9): | -0.1034 | |
| Courbe Coppock: | 4.75 |
| MA7: | 0.019638 | |
| MA20: | 0.021647 | |
| MA50: | 0.023956 | |
| MA100: | 0.029631 | |
| MAexp7: | 0.018057 | |
| MAexp20: | 0.018301 | |
| MAexp50: | 0.018675 | |
| MAexp100: | 0.019186 | |
| Price / MA7: | -11.67% | |
| Price / MA20: | -19.86% | |
| Price / MA50: | -27.59% | |
| Price / MA100: | -41.46% | |
| Price / MAexp7: | -3.93% | |
| Price / MAexp20: | -5.21% | |
| Price / MAexp50: | -7.11% | |
| Price / MAexp100: | -9.59% |