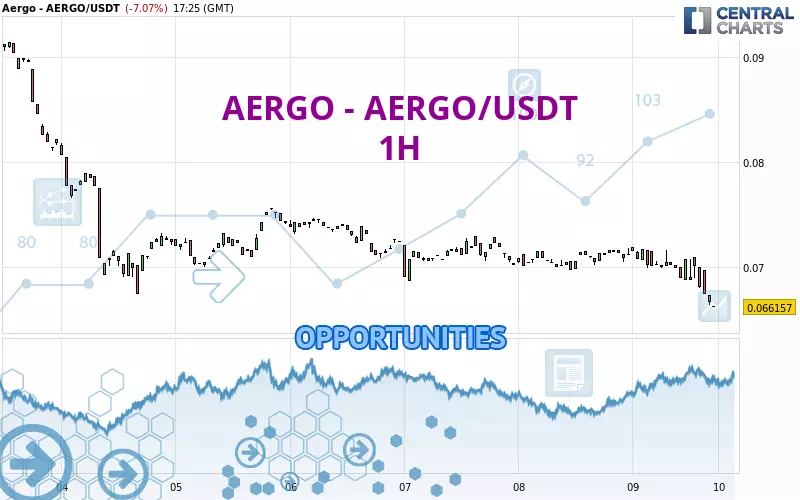
Londinia Opportunities Analyses - 03/09/2025 (GMT) AERGO - AERGO/USDT - 1H
| Type: | Cryptocurrencies |
| Ticker: | AERGOUSDT |
| ISIN: |
- Cryptocurrencies
- Timeframe : 1H
- - Analysis generated on
- Status : LEVEL MAINTAINED
Summary of the analysis
Additional analysis
Quotes
The AERGO - AERGO/USDT rating is 0.066157 USDT. On the day, this instrument lost -7.07% and was between 0.066157 USDT and 0.071932 USDT. This implies that the price is at 0% from its lowest and at -8.03% from its highest.The Central Gaps scanner detects a bearish opening marking the presence of sellers ahead of buyers at the opening but not sufficiently marked to allow the price to register a quotation gap.
Bullish opening
Type : Bullish
Timeframe : Openning
Bearish opening
Type : Bearish
Timeframe : Openning
Here is a more detailed summary of the historical variations registered by AERGO - AERGO/USDT:
New LOW record (1 year)
Type : Bearish
Timeframe : Weekly
New LOW record (1st january)
Type : Bearish
Timeframe : Weekly
New LOW record (1 month)
Type : Bearish
Timeframe : Weekly
Technical
Technical analysis of AERGO - AERGO/USDT in 1H shows a overall strongly bearish trend. The signals given by moving averages are 92.86% bearish. This strong bearish trend is confirmed by the strong signals currently being given by short-term moving averages. An assessment of moving averages reveals several bearish and bullish signals:
Bullish trend reversal : Moving Average 20
Type : Bullish
Timeframe : 1 hour
Bearish trend reversal : adaptative moving average 20
Type : Bearish
Timeframe : 1 hour
Technical indicators are strongly bearish, suggesting that the price decline is expected to continue.
Caution: the Central Indicators scanner currently detects an excess:
CCI indicator is oversold : under -100
Type : Neutral
Timeframe : 1 hour
Williams %R indicator is oversold : under -80
Type : Neutral
Timeframe : 1 hour
Pivot points : price is under support 3
Type : Neutral
Timeframe : 1 hour
Pivot points : price is under support 3
Type : Neutral
Timeframe : Weekly
The analysis of the price chart with Central Patterns scanners does not return any result.
For a small setback in the very short term, the Central Candlesticks scanner currently notes the presence of this bearish pattern in Japanese candlesticks:
Downside gap
Type : Bearish
Timeframe : 1 hour
| Price | R1 | R2 | R3 | |
|---|---|---|---|---|
| ProTrendLines | 0.066157 | 0.068671 | 0.073224 | 0.081981 |
| Change (%) | - | +3.80% | +10.68% | +23.92% |
| Change | - | +0.002514 | +0.007067 | +0.015824 |
| Level | - | Intermediate | Minor | Minor |
Pivot points can also be used to set your price objectives. Here is the price situation in relation to pivot points:
| Pivot points | S3 | S2 | S1 | PP | R1 | R2 | R3 |
|---|---|---|---|---|---|---|---|
| Standard | 0.067817 | 0.068740 | 0.069964 | 0.070887 | 0.072111 | 0.073034 | 0.074258 |
| Camarilla | 0.070598 | 0.070794 | 0.070991 | 0.071188 | 0.071385 | 0.071582 | 0.071778 |
| Woodie | 0.067968 | 0.068815 | 0.070115 | 0.070962 | 0.072262 | 0.073109 | 0.074409 |
| Fibonacci | 0.068740 | 0.069560 | 0.070067 | 0.070887 | 0.071707 | 0.072214 | 0.073034 |
| Pivot points | S3 | S2 | S1 | PP | R1 | R2 | R3 |
|---|---|---|---|---|---|---|---|
| Standard | 0.031416 | 0.049419 | 0.060303 | 0.078306 | 0.089190 | 0.107193 | 0.118077 |
| Camarilla | 0.063244 | 0.065892 | 0.068540 | 0.071188 | 0.073836 | 0.076484 | 0.079132 |
| Woodie | 0.027858 | 0.047639 | 0.056745 | 0.076526 | 0.085632 | 0.105413 | 0.114519 |
| Fibonacci | 0.049419 | 0.060454 | 0.067271 | 0.078306 | 0.089341 | 0.096158 | 0.107193 |
| Pivot points | S3 | S2 | S1 | PP | R1 | R2 | R3 |
|---|---|---|---|---|---|---|---|
| Standard | 0.036100 | 0.054160 | 0.071445 | 0.089505 | 0.106790 | 0.124850 | 0.142135 |
| Camarilla | 0.079009 | 0.082249 | 0.085489 | 0.088729 | 0.091969 | 0.095209 | 0.098449 |
| Woodie | 0.035712 | 0.053966 | 0.071057 | 0.089311 | 0.106402 | 0.124656 | 0.141747 |
| Fibonacci | 0.054160 | 0.067662 | 0.076004 | 0.089505 | 0.103007 | 0.111349 | 0.124850 |
Numerical data
The following is the status of technical indicators and moving averages registered at the time this technical analysis was created:
| RSI (14): | 34.40 | |
| MACD (12,26,9): | -0.0008 | |
| Directional Movement: | -14.468079 | |
| AROON (14): | -100.000000 | |
| DEMA (21): | 0.068646 | |
| Parabolic SAR (0,02-0,02-0,2): | 0.070550 | |
| Elder Ray (13): | -0.002293 | |
| Super Trend (3,10): | 0.070677 | |
| Zig ZAG (10): | 0.066609 | |
| VORTEX (21): | 0.7361 | |
| Stochastique (14,3,5): | 2.47 | |
| TEMA (21): | 0.068070 | |
| Williams %R (14): | -94.65 | |
| Chande Momentum Oscillator (20): | -0.003462 | |
| Repulse (5,40,3): | -5.7808 | |
| ROCnROLL: | 2 | |
| TRIX (15,9): | -0.0872 | |
| Courbe Coppock: | 6.95 |
| MA7: | 0.072732 | |
| MA20: | 0.084466 | |
| MA50: | 0.092356 | |
| MA100: | 0.117249 | |
| MAexp7: | 0.068363 | |
| MAexp20: | 0.069554 | |
| MAexp50: | 0.070503 | |
| MAexp100: | 0.072156 | |
| Price / MA7: | -9.04% | |
| Price / MA20: | -21.68% | |
| Price / MA50: | -28.37% | |
| Price / MA100: | -43.58% | |
| Price / MAexp7: | -3.23% | |
| Price / MAexp20: | -4.88% | |
| Price / MAexp50: | -6.16% | |
| Price / MAexp100: | -8.31% |