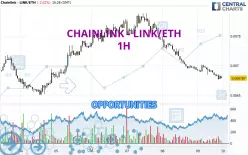
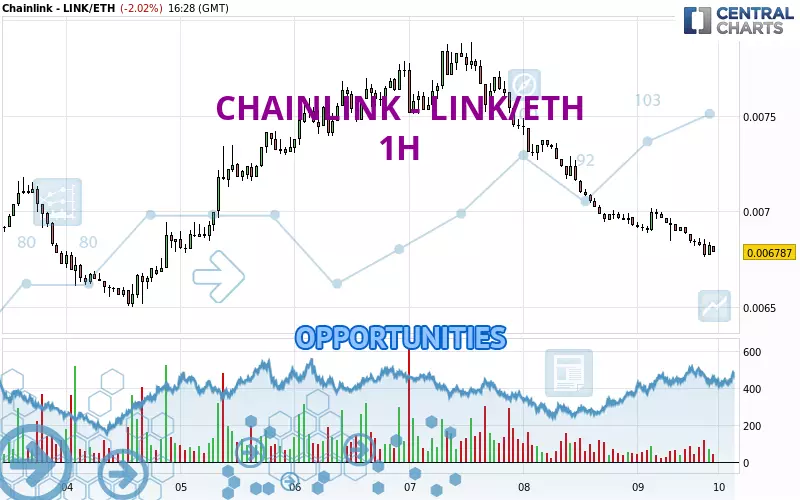
Londinia Opportunities Analyses - 03/09/2025 (GMT) CHAINLINK - LINK/ETH - 1H
| Type: | Cryptocurrencies |
| Ticker: | LINKETH |
| ISIN: |
- Cryptocurrencies
- Timeframe : 1H
- - Analysis generated on
- Status : LEVEL MAINTAINED
Summary of the analysis
Additional analysis
Quotes
The CHAINLINK - LINK/ETH rating is 0.006794 ETH. The price registered a decrease of -1.92% on the session and was traded between 0.006761 ETH and 0.007017 ETH over the period. The price is currently at +0.49% from its lowest and -3.18% from its highest.A study of price movements over other periods shows the following variations:
Near a new HIGH record (1 year)
Type : Bullish
Timeframe : Weekly
Near a new HIGH record (1st january)
Type : Bullish
Timeframe : Weekly
New HIGH record (1 month)
Type : Bullish
Timeframe : Weekly
Technical
Technical analysis of this 1H chart of CHAINLINK - LINK/ETH indicates that the overall trend is strongly bearish. 92.86% of the signals given by moving averages are bearish. This strongly bearish trend is supported by the strong bearish signals given by short-term moving averages. An assessment of moving averages reveals a bearish signal that could impact this trend:
Bearish trend reversal : adaptative moving average 50
Type : Bearish
Timeframe : 1 hour
In fact, 11 technical indicators on 18 studied are currently bearish. Caution: the Central Indicators scanner currently detects an excess:
CCI indicator is oversold : under -100
Type : Neutral
Timeframe : 1 hour
Williams %R indicator is oversold : under -80
Type : Neutral
Timeframe : 1 hour
Pivot points : price is over resistance 2
Type : Neutral
Timeframe : Weekly
The analysis of the price chart with Central Patterns scanners does not return any result.
Central Candlesticks, the scanner specialised in Japanese candlesticks, detects these bearish signals that could support the hypothesis of a small drop in the very short term:
Bearish harami
Type : Bearish
Timeframe : 1 hour
Bearish harami cross
Type : Bearish
Timeframe : 1 hour
Three black crows
Type : Bearish
Timeframe : 1 hour
| S3 | S2 | S1 | Price | R1 | R2 | R3 | |
|---|---|---|---|---|---|---|---|
| ProTrendLines | 0.006123 | 0.006555 | 0.006789 | 0.006794 | 0.006912 | 0.007180 | 0.007391 |
| Change (%) | -9.88% | -3.52% | -0.07% | - | +1.74% | +5.68% | +8.79% |
| Change | -0.000671 | -0.000239 | -0.000005 | - | +0.000118 | +0.000386 | +0.000597 |
| Level | Major | Major | Minor | - | Minor | Intermediate | Minor |
To determine price objectives, it is also possible to use the pivot points. Here is the price position in relation to pivot points:
| Pivot points | S3 | S2 | S1 | PP | R1 | R2 | R3 |
|---|---|---|---|---|---|---|---|
| Standard | 0.006171 | 0.006547 | 0.006737 | 0.007113 | 0.007303 | 0.007679 | 0.007869 |
| Camarilla | 0.006771 | 0.006823 | 0.006875 | 0.006927 | 0.006979 | 0.007031 | 0.007083 |
| Woodie | 0.006078 | 0.006501 | 0.006644 | 0.007067 | 0.007210 | 0.007633 | 0.007776 |
| Fibonacci | 0.006547 | 0.006763 | 0.006897 | 0.007113 | 0.007329 | 0.007463 | 0.007679 |
| Pivot points | S3 | S2 | S1 | PP | R1 | R2 | R3 |
|---|---|---|---|---|---|---|---|
| Standard | 0.004936 | 0.005718 | 0.006322 | 0.007104 | 0.007708 | 0.008490 | 0.009094 |
| Camarilla | 0.006546 | 0.006673 | 0.006800 | 0.006927 | 0.007054 | 0.007181 | 0.007308 |
| Woodie | 0.004848 | 0.005674 | 0.006234 | 0.007060 | 0.007620 | 0.008446 | 0.009006 |
| Fibonacci | 0.005718 | 0.006247 | 0.006574 | 0.007104 | 0.007633 | 0.007960 | 0.008490 |
| Pivot points | S3 | S2 | S1 | PP | R1 | R2 | R3 |
|---|---|---|---|---|---|---|---|
| Standard | 0.003659 | 0.004799 | 0.005711 | 0.006851 | 0.007763 | 0.008903 | 0.009815 |
| Camarilla | 0.006060 | 0.006248 | 0.006436 | 0.006624 | 0.006812 | 0.007000 | 0.007188 |
| Woodie | 0.003546 | 0.004742 | 0.005598 | 0.006794 | 0.007650 | 0.008846 | 0.009702 |
| Fibonacci | 0.004799 | 0.005583 | 0.006067 | 0.006851 | 0.007635 | 0.008119 | 0.008903 |
Numerical data
The following is the status of the technical indicators and moving averages at the time of publication of this technical analysis:
| RSI (14): | 31.49 | |
| MACD (12,26,9): | -0.0001 | |
| Directional Movement: | -27.609965 | |
| AROON (14): | -78.571429 | |
| DEMA (21): | 0.006784 | |
| Parabolic SAR (0,02-0,02-0,2): | 0.006943 | |
| Elder Ray (13): | -0.000053 | |
| Super Trend (3,10): | 0.006964 | |
| Zig ZAG (10): | 0.006804 | |
| VORTEX (21): | 0.8447 | |
| Stochastique (14,3,5): | 14.45 | |
| TEMA (21): | 0.006794 | |
| Williams %R (14): | -83.98 | |
| Chande Momentum Oscillator (20): | -0.000185 | |
| Repulse (5,40,3): | -0.6622 | |
| ROCnROLL: | 2 | |
| TRIX (15,9): | -0.1913 | |
| Courbe Coppock: | 3.28 |
| MA7: | 0.007119 | |
| MA20: | 0.006726 | |
| MA50: | 0.007083 | |
| MA100: | 0.006814 | |
| MAexp7: | 0.006830 | |
| MAexp20: | 0.006910 | |
| MAexp50: | 0.007079 | |
| MAexp100: | 0.007150 | |
| Price / MA7: | -4.57% | |
| Price / MA20: | +1.01% | |
| Price / MA50: | -4.08% | |
| Price / MA100: | -0.29% | |
| Price / MAexp7: | -0.53% | |
| Price / MAexp20: | -1.68% | |
| Price / MAexp50: | -4.03% | |
| Price / MAexp100: | -4.98% |