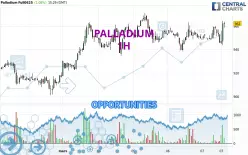
Londinia Opportunities Analyses - 03/07/2025 (GMT) PALLADIUM - 1H
- FX/Indices
- Timeframe : 1H
- - Analysis generated on
- Status : INVALID
Summary of the analysis

Additional analysis
Quotes
PALLADIUM rating 962.50 USD. The price registered an increase of +1.14% on the session with the lowest point at 943.50 USD and the highest point at 964.50 USD. The deviation from the price is +2.01% for the low point and -0.21% for the high point.So that you have an overall view of the price change, here is a table showing the variations over several periods:
Near a new LOW record (1st january)
Type : Bearish
Timeframe : Weekly
Near a new LOW record (1 month)
Type : Bearish
Timeframe : Weekly
Technical
Technical analysis of this 1H chart of PALLADIUM indicates that the overall trend is strongly bullish. 92.86% of the signals given by moving averages are bullish. This strongly bullish trend is supported by the strong bullish signals given by short-term moving averages. The Central Indicators scanner detects bullish signals on moving averages that could impact this trend:
Bullish trend reversal : Moving Average 20
Type : Bullish
Timeframe : 1 hour
Bullish trend reversal : Moving Average 50
Type : Bullish
Timeframe : 1 hour
Bullish trend reversal : adaptative moving average 20
Type : Bullish
Timeframe : 1 hour
Bullish trend reversal : adaptative moving average 50
Type : Bullish
Timeframe : 1 hour
Bullish trend reversal : adaptative moving average 100
Type : Bullish
Timeframe : 1 hour
In fact, according to the parameters integrated into the Central Analyzer system, 15 technical indicators out of 18 analysed are currently bullish. Caution: the Central Indicators scanner currently detects an excess:
Previous candle closed over Bollinger bands
Type : Neutral
Timeframe : 1 hour
Pivot points : price is over resistance 1
Type : Neutral
Timeframe : 1 hour
Price is back over the pivot point
Type : Bullish
Timeframe : Weekly
No signals are given by Central Patterns, a market scanner specialised in chart patterns, resistances and supports.
The presence of a bullish Japanese candlestick pattern detected by Central Candlesticks that could cause a very short term rebound was also detected:
Long white line
Type : Bullish
Timeframe : 1 hour
| S3 | S2 | S1 | Price | R1 | R2 | R3 | |
|---|---|---|---|---|---|---|---|
| ProTrendLines | 939.06 | 952.50 | 958.90 | 962.50 | 971.00 | 1,001.84 | 1,053.03 |
| Change (%) | -2.44% | -1.04% | -0.37% | - | +0.88% | +4.09% | +9.41% |
| Change | -23.44 | -10.00 | -3.60 | - | +8.50 | +39.34 | +90.53 |
| Level | Intermediate | Minor | Intermediate | - | Minor | Intermediate | Intermediate |
Pivot points can also be used to set your price objectives. Here is the price situation in relation to pivot points:
| Pivot points | S3 | S2 | S1 | PP | R1 | R2 | R3 |
|---|---|---|---|---|---|---|---|
| Standard | 915.47 | 927.23 | 939.47 | 951.23 | 963.47 | 975.23 | 987.47 |
| Camarilla | 945.10 | 947.30 | 949.50 | 951.70 | 953.90 | 956.10 | 958.30 |
| Woodie | 915.70 | 927.35 | 939.70 | 951.35 | 963.70 | 975.35 | 987.70 |
| Fibonacci | 927.23 | 936.40 | 942.07 | 951.23 | 960.40 | 966.07 | 975.23 |
| Pivot points | S3 | S2 | S1 | PP | R1 | R2 | R3 |
|---|---|---|---|---|---|---|---|
| Standard | 780.93 | 840.97 | 876.43 | 936.47 | 971.93 | 1,031.97 | 1,067.43 |
| Camarilla | 885.64 | 894.39 | 903.15 | 911.90 | 920.65 | 929.41 | 938.16 |
| Woodie | 768.65 | 834.83 | 864.15 | 930.33 | 959.65 | 1,025.83 | 1,055.15 |
| Fibonacci | 840.97 | 877.45 | 899.99 | 936.47 | 972.95 | 995.49 | 1,031.97 |
| Pivot points | S3 | S2 | S1 | PP | R1 | R2 | R3 |
|---|---|---|---|---|---|---|---|
| Standard | 668.27 | 784.63 | 848.27 | 964.63 | 1,028.27 | 1,144.63 | 1,208.27 |
| Camarilla | 862.40 | 878.90 | 895.40 | 911.90 | 928.40 | 944.90 | 961.40 |
| Woodie | 641.90 | 771.45 | 821.90 | 951.45 | 1,001.90 | 1,131.45 | 1,181.90 |
| Fibonacci | 784.63 | 853.39 | 895.87 | 964.63 | 1,033.39 | 1,075.87 | 1,144.63 |
Numerical data
The following is the status of the technical indicators and moving averages at the time of publication of this technical analysis:
| RSI (14): | 61.10 | |
| MACD (12,26,9): | 0.6300 | |
| Directional Movement: | 10.69 | |
| AROON (14): | 0 | |
| DEMA (21): | 953.03 | |
| Parabolic SAR (0,02-0,02-0,2): | 944.50 | |
| Elder Ray (13): | 1.19 | |
| Super Trend (3,10): | 944.84 | |
| Zig ZAG (10): | 962.50 | |
| VORTEX (21): | 1.0600 | |
| Stochastique (14,3,5): | 64.90 | |
| TEMA (21): | 956.12 | |
| Williams %R (14): | -9.52 | |
| Chande Momentum Oscillator (20): | 12.50 | |
| Repulse (5,40,3): | 1.0400 | |
| ROCnROLL: | 1 | |
| TRIX (15,9): | 0.0100 | |
| Courbe Coppock: | 0.94 |
| MA7: | 943.94 | |
| MA20: | 974.93 | |
| MA50: | 974.47 | |
| MA100: | 998.42 | |
| MAexp7: | 955.80 | |
| MAexp20: | 952.55 | |
| MAexp50: | 951.62 | |
| MAexp100: | 949.58 | |
| Price / MA7: | +1.97% | |
| Price / MA20: | -1.27% | |
| Price / MA50: | -1.23% | |
| Price / MA100: | -3.60% | |
| Price / MAexp7: | +0.70% | |
| Price / MAexp20: | +1.04% | |
| Price / MAexp50: | +1.14% | |
| Price / MAexp100: | +1.36% |
News
The last news published on PALLADIUM at the time of the generation of this analysis was as follows:
-
 Palladium Mining Stocks Great Opportunity To Invest In 2024?
-
Will palladium continue to drive higher? – 27 November 2020
-
Will palladium set a new record high? – 6th February 2020
-
“Buzz on the Street” Show: Palladium One Mining (TSX-V: PDM) (OTC: NKORF) News Report
-
Will palladium retest the recent all time high? – 21st November 2019