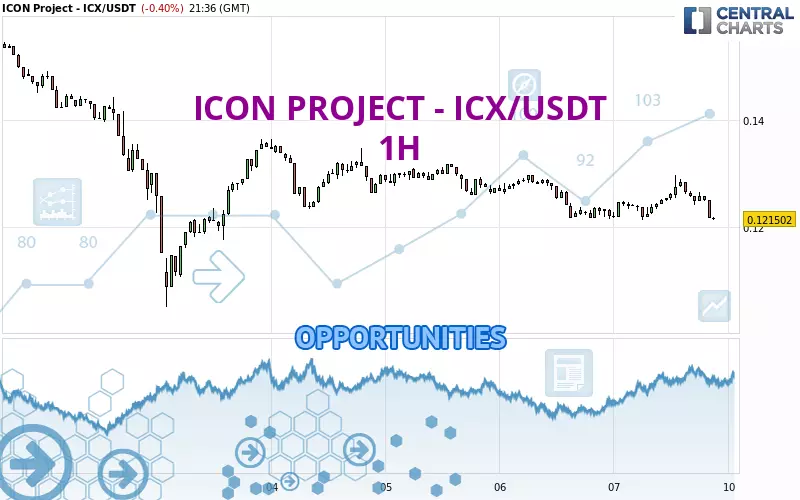
Londinia Opportunities Analyses - 02/07/2025 (GMT) ICON PROJECT - ICX/USDT - 1H
| Type: | Cryptocurrencies |
| Ticker: | ICXUSDT |
| ISIN: |
- Cryptocurrencies
- Timeframe : 1H
- - Analysis generated on
- Status : LEVEL MAINTAINED
Summary of the analysis

Additional analysis
Quotes
The ICON PROJECT - ICX/USDT price is 0.121259 USDT. The price is lower by -0.60% since the last closing and was traded between 0.121259 USDT and 0.129627 USDT over the period. The price is currently at 0% from its lowest and -6.46% from its highest.A bullish opening was detected by the Central Gaps scanner. Buyers are trying to impose a bullish momentum in the very short term.
Bullish opening
Type : Bullish
Timeframe : Openning
So that you have an overall view of the price change, here is a table showing the variations over several periods:
New LOW record (5 years)
Type : Bearish
Timeframe : Weekly
Technical
Technical analysis of ICON PROJECT - ICX/USDT in 1H shows a overall strongly bearish trend. 92.86% of the signals given by moving averages are bearish. This strongly bearish trend is supported by the strong bearish signals given by short-term moving averages. The Central Indicators scanner detects a bearish signal on moving averages that could impact this trend:
Bearish trend reversal : Moving Average 20
Type : Bearish
Timeframe : 1 hour
In fact, according to the parameters integrated into the Central Analyzer system, 12 technical indicators out of 18 analysed are currently bearish. But beware of excesses. The Central Indicators scanner currently detects this:
CCI indicator is oversold : under -100
Type : Neutral
Timeframe : 1 hour
Williams %R indicator is oversold : under -80
Type : Neutral
Timeframe : 1 hour
Pivot points : price is under support 3
Type : Neutral
Timeframe : Weekly
The Central Patterns scanner, which studies chart patterns, resistances and supports, has identified these signals:
Near horizontal support
Type : Bullish
Timeframe : 1 hour
Near support of triangle
Type : Bullish
Timeframe : 1 hour
From the Japanese candlestick perspective, the Central Candlesticks scanner notes the presence of these results that could impact the short-term trend:
Bullish doji star
Type : Bullish
Timeframe : 1 hour
Downside gap
Type : Bearish
Timeframe : 1 hour
| S2 | S1 | Price | R1 | R2 | R3 | |
|---|---|---|---|---|---|---|
| ProTrendLines | 0.105170 | 0.116442 | 0.121259 | 0.121654 | 0.126068 | 0.136441 |
| Change (%) | -13.27% | -3.97% | - | +0.33% | +3.97% | +12.52% |
| Change | -0.016089 | -0.004817 | - | +0.000395 | +0.004809 | +0.015182 |
| Level | Major | Major | - | Minor | Intermediate | Minor |
Attention could also be paid to pivot points to set price objectives:
| Pivot points | S3 | S2 | S1 | PP | R1 | R2 | R3 |
|---|---|---|---|---|---|---|---|
| Standard | 0.110961 | 0.116248 | 0.119120 | 0.124407 | 0.127279 | 0.132566 | 0.135438 |
| Camarilla | 0.119749 | 0.120497 | 0.121245 | 0.121993 | 0.122741 | 0.123489 | 0.124237 |
| Woodie | 0.109755 | 0.115644 | 0.117914 | 0.123803 | 0.126073 | 0.131962 | 0.134232 |
| Fibonacci | 0.116248 | 0.119364 | 0.121290 | 0.124407 | 0.127523 | 0.129449 | 0.132566 |
| Pivot points | S3 | S2 | S1 | PP | R1 | R2 | R3 |
|---|---|---|---|---|---|---|---|
| Standard | 0.106441 | 0.125714 | 0.135955 | 0.155228 | 0.165469 | 0.184742 | 0.194983 |
| Camarilla | 0.138080 | 0.140785 | 0.143491 | 0.146196 | 0.148902 | 0.151607 | 0.154312 |
| Woodie | 0.101925 | 0.123456 | 0.131439 | 0.152970 | 0.160953 | 0.182484 | 0.190467 |
| Fibonacci | 0.125714 | 0.136988 | 0.143954 | 0.155228 | 0.166502 | 0.173468 | 0.184742 |
| Pivot points | S3 | S2 | S1 | PP | R1 | R2 | R3 |
|---|---|---|---|---|---|---|---|
| Standard | 0.057951 | 0.103101 | 0.129907 | 0.175057 | 0.201863 | 0.247013 | 0.273819 |
| Camarilla | 0.136924 | 0.143520 | 0.150116 | 0.156712 | 0.163308 | 0.169904 | 0.176500 |
| Woodie | 0.048778 | 0.098515 | 0.120734 | 0.170471 | 0.192690 | 0.242427 | 0.264646 |
| Fibonacci | 0.103101 | 0.130589 | 0.147570 | 0.175057 | 0.202545 | 0.219526 | 0.247013 |
Numerical data
The following is the status of the technical indicators and moving averages at the time of publication of this technical analysis:
| RSI (14): | 38.19 | |
| MACD (12,26,9): | -0.0003 | |
| Directional Movement: | -13.747844 | |
| AROON (14): | -57.142857 | |
| DEMA (21): | 0.124275 | |
| Parabolic SAR (0,02-0,02-0,2): | 0.129470 | |
| Elder Ray (13): | -0.002719 | |
| Super Trend (3,10): | 0.126551 | |
| Zig ZAG (10): | 0.121775 | |
| VORTEX (21): | 0.9885 | |
| Stochastique (14,3,5): | 15.70 | |
| TEMA (21): | 0.124387 | |
| Williams %R (14): | -98.25 | |
| Chande Momentum Oscillator (20): | -0.002680 | |
| Repulse (5,40,3): | -2.7146 | |
| ROCnROLL: | 2 | |
| TRIX (15,9): | 0.0030 | |
| Courbe Coppock: | 1.63 |
| MA7: | 0.130279 | |
| MA20: | 0.151592 | |
| MA50: | 0.174155 | |
| MA100: | 0.182402 | |
| MAexp7: | 0.123932 | |
| MAexp20: | 0.124592 | |
| MAexp50: | 0.125506 | |
| MAexp100: | 0.128185 | |
| Price / MA7: | -6.92% | |
| Price / MA20: | -20.01% | |
| Price / MA50: | -30.37% | |
| Price / MA100: | -33.52% | |
| Price / MAexp7: | -2.16% | |
| Price / MAexp20: | -2.68% | |
| Price / MAexp50: | -3.38% | |
| Price / MAexp100: | -5.40% |