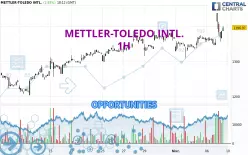
Londinia Opportunities Analyses - 02/07/2025 (GMT) METTLER-TOLEDO INTL. - 1H
- U.S. Stocks
- Timeframe : 1H
- - Analysis generated on
- Status : INVALID
Summary of the analysis
Trends
Short term:
Strongly bullish
Underlying:
Strongly bullish
Technical indicators
56%
17%
28%
My opinion
Bullish above 1,387.20 USD
My targets
1,411.52 USD (+1.17%)
1,440.28 USD (+3.24%)
My analysis
All elements being clearly bullish, it would be possible for traders to trade only long positions (at the time of purchase) on METTLER-TOLEDO INTL. as long as the price remains well above 1,387.20 USD. The buyers' bullish objective is set at 1,411.52 USD. A bullish break in this resistance would boost the bullish momentum. The buyers could then target the resistance located at 1,440.28 USD. If there is any crossing, the next objective would be the resistance located at 1,530.55 USD. However, beware of bullish excesses that could lead to a possible short-term correction; but this possible correction would not be tradeable.
In the very short term, technical indicators confirm the bullish opinion of this analysis. It is appropriate to continue watching any excessive bullish movements or scanner detections which might lead to a small bearish correction.
Force
0
10
7.3

Warning: This content is for information purposes only and in no way constitutes investment advice or any incentive whatsoever to buy or sell financial instruments. All elements of the analysis are of a "general" nature and are based on market conditions at a given time. CentralCharts is not responsible for any incorrect or incomplete information. Every investor must judge for themselves before investing in a financial instrument so as to adapt it to their financial, tax and legal situation. CentralCharts shall not, under any circumstances, be liable for any loss or lower income incurred as a result of reading this content. Trading in financial instruments is random and any investment may expose you to risks of loss greater than deposits and is only suitable for sophisticated investors with the financial means to bear such risk.
Additional analysis
Quotes
The METTLER-TOLEDO INTL. price is 1,395.14 USD. The price registered an increase of +2.79% on the session with the lowest point at 1,357.17 USD and the highest point at 1,438.46 USD. The deviation from the price is +2.80% for the low point and -3.01% for the high point.1,357.17
1,438.46
1,395.14
The Central Gaps scanner detects a bullish gap which is a sign that buyers have taken the lead in the very short term.
Opening Gap UP
Type : Bullish
Timeframe : Openning
Here is a more detailed summary of the historical variations registered by METTLER-TOLEDO INTL.:
New HIGH record (1st january)
Type : Bullish
Timeframe : Weekly
New HIGH record (1 month)
Type : Bullish
Timeframe : Weekly
Technical
Technical analysis of this 1H chart of METTLER-TOLEDO INTL. indicates that the overall trend is strongly bullish. The signals given by the moving averages are 92.86% bullish. This strong bullish trend is confirmed by the strong signals currently being given by short-term moving averages. There is no crossing of moving average by the price or crossing of moving averages between themselves.
In fact, according to the parameters integrated into the Central Analyzer system, 10 technical indicators out of 18 analysed are currently bullish. Central Indicators, the detector scanner for these technical indicators has recently detected several signals:
Pivot points : price is over resistance 2
Type : Neutral
Timeframe : 1 hour
Price is back over the pivot point
Type : Bullish
Timeframe : Weekly
The analysis of the price chart with Central Patterns scanners does not return any result.
Central Candlesticks, the scanner specialised in Japanese candlesticks, detects a bullish signal that could support the hypothesis of a small rebound in the very short term:
Bullish engulfing lines
Type : Bullish
Timeframe : 1 hour
ProTrendLines
S3
S2
S1
R1
R2
R3
Price
| S3 | S2 | S1 | Price | R1 | R2 | R3 | |
|---|---|---|---|---|---|---|---|
| ProTrendLines | 1,309.88 | 1,355.25 | 1,387.20 | 1,395.14 | 1,411.52 | 1,440.28 | 1,530.55 |
| Change (%) | -6.11% | -2.86% | -0.57% | - | +1.17% | +3.24% | +9.71% |
| Change | -85.26 | -39.89 | -7.94 | - | +16.38 | +45.14 | +135.41 |
| Level | Intermediate | Major | Major | - | Minor | Minor | Major |
Attention could also be paid to pivot points to set price objectives:
Daily
| Pivot points | S3 | S2 | S1 | PP | R1 | R2 | R3 |
|---|---|---|---|---|---|---|---|
| Standard | 1,322.33 | 1,334.05 | 1,345.66 | 1,357.38 | 1,368.99 | 1,380.71 | 1,392.32 |
| Camarilla | 1,350.84 | 1,352.98 | 1,355.12 | 1,357.26 | 1,359.40 | 1,361.54 | 1,363.68 |
| Woodie | 1,322.27 | 1,334.02 | 1,345.60 | 1,357.35 | 1,368.93 | 1,380.68 | 1,392.26 |
| Fibonacci | 1,334.05 | 1,342.97 | 1,348.47 | 1,357.38 | 1,366.30 | 1,371.80 | 1,380.71 |
Weekly
| Pivot points | S3 | S2 | S1 | PP | R1 | R2 | R3 |
|---|---|---|---|---|---|---|---|
| Standard | 1,252.36 | 1,283.92 | 1,324.18 | 1,355.74 | 1,396.00 | 1,427.56 | 1,467.82 |
| Camarilla | 1,344.69 | 1,351.27 | 1,357.86 | 1,364.44 | 1,371.02 | 1,377.61 | 1,384.19 |
| Woodie | 1,256.71 | 1,286.10 | 1,328.53 | 1,357.92 | 1,400.35 | 1,429.74 | 1,472.17 |
| Fibonacci | 1,283.92 | 1,311.36 | 1,328.31 | 1,355.74 | 1,383.18 | 1,400.13 | 1,427.56 |
Monthly
| Pivot points | S3 | S2 | S1 | PP | R1 | R2 | R3 |
|---|---|---|---|---|---|---|---|
| Standard | 1,065.08 | 1,134.09 | 1,249.27 | 1,318.28 | 1,433.46 | 1,502.47 | 1,617.65 |
| Camarilla | 1,313.79 | 1,330.67 | 1,347.56 | 1,364.44 | 1,381.32 | 1,398.21 | 1,415.09 |
| Woodie | 1,088.16 | 1,145.63 | 1,272.35 | 1,329.82 | 1,456.54 | 1,514.01 | 1,640.73 |
| Fibonacci | 1,134.09 | 1,204.45 | 1,247.92 | 1,318.28 | 1,388.64 | 1,432.11 | 1,502.47 |
Numerical data
The following is the status of technical indicators and moving averages registered at the time this technical analysis was created:
Technical indicators
Moving averages
| RSI (14): | 56.62 | |
| MACD (12,26,9): | 6.8000 | |
| Directional Movement: | 9.02 | |
| AROON (14): | 14.28 | |
| DEMA (21): | 1,374.50 | |
| Parabolic SAR (0,02-0,02-0,2): | 1,357.17 | |
| Elder Ray (13): | 4.79 | |
| Super Trend (3,10): | 1,359.70 | |
| Zig ZAG (10): | 1,384.75 | |
| VORTEX (21): | 0.9500 | |
| Stochastique (14,3,5): | 36.54 | |
| TEMA (21): | 1,378.96 | |
| Williams %R (14): | -57.95 | |
| Chande Momentum Oscillator (20): | 18.23 | |
| Repulse (5,40,3): | -0.0700 | |
| ROCnROLL: | 1 | |
| TRIX (15,9): | 0.0400 | |
| Courbe Coppock: | 2.31 |
| MA7: | 1,359.67 | |
| MA20: | 1,324.37 | |
| MA50: | 1,277.47 | |
| MA100: | 1,319.73 | |
| MAexp7: | 1,376.18 | |
| MAexp20: | 1,366.63 | |
| MAexp50: | 1,357.38 | |
| MAexp100: | 1,340.44 | |
| Price / MA7: | +2.61% | |
| Price / MA20: | +5.34% | |
| Price / MA50: | +9.21% | |
| Price / MA100: | +5.71% | |
| Price / MAexp7: | +1.38% | |
| Price / MAexp20: | +2.09% | |
| Price / MAexp50: | +2.78% | |
| Price / MAexp100: | +4.08% |
Quotes :
-
15 min delayed data
-
Actions NYSE
News
Don't forget to follow the news on METTLER-TOLEDO INTL.. At the time of publication of this analysis, the latest news was as follows:
- Mettler-Toledo International Inc. to Host Fourth Quarter 2024 Earnings Conference Call
- Mettler-Toledo International Inc. to Present at the 43rd Annual J.P. Morgan Healthcare Conference
- Wolfgang Wienand to Join Mettler Toledo Board of Directors
- Mettler-Toledo International Inc. to Host Second Quarter 2023 Earnings Conference Call
- Mettler-Toledo International Inc. Announces Webcast of Presentation at Jefferies 2019 Healthcare Conference