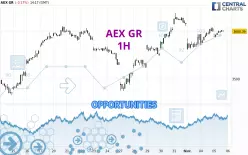
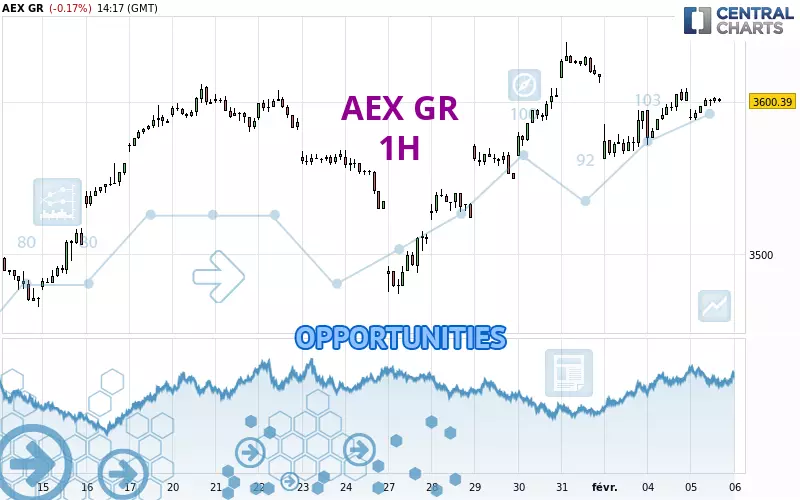
Londinia Opportunities Analyses - 02/05/2025 (GMT) AEX GR - 1H
| Type: | Indices |
| Ticker: | AEXGR |
| ISIN: | QS0011131990 |
- FX/Indices
- Timeframe : 1H
- - Analysis generated on
- Status : LEVEL MAINTAINED
Summary of the analysis
Additional analysis
Quotes
The AEX GR price is 3,600.13 EUR. The price registered a decrease of -0.18% on the session and was between 3,588.07 EUR and 3,603.36 EUR. This implies that the price is at +0.34% from its lowest and at -0.09% from its highest.The Central Gaps scanner detects a bearish opening. A small advantage for sellers in the very short term.
Bearish opening
Type : Bearish
Timeframe : Openning
A study of price movements over other periods shows the following variations:
Near a new HIGH record (5 years)
Type : Bullish
Timeframe : Weekly
Near a new HIGH record (1 year)
Type : Bullish
Timeframe : Weekly
Near a new LOW record (1st january)
Type : Bearish
Timeframe : Weekly
Near a new LOW record (1 month)
Type : Bearish
Timeframe : Weekly
Technical
A technical analysis in 1H of this AEX GR chart shows a strongly bullish trend. 92.86% of the signals given by moving averages are bullish. This strongly bullish trend is supported by the strong bullish signals given by short-term moving averages. The Central Indicators scanner detects bullish signals on moving averages that could impact this trend:
Moving Average bullish crossovers : MA20 & MA50
Type : Bullish
Timeframe : 1 hour
Moving Average bullish crossovers : AMA50 & AMA100
Type : Bullish
Timeframe : 1 hour
An assessment of technical indicators shows a moderate bullish signal.
Central Indicators, the scanner specialised in technical indicators, has identified this signal:
Price is back over the pivot point
Type : Bullish
Timeframe : Weekly
No signals are given by Central Patterns, a market scanner specialised in chart patterns, resistances and supports.
From the Japanese candlestick perspective, the Central Candlesticks scanner notes the presence of these results that could impact the short-term trend:
Bearish harami
Type : Bearish
Timeframe : 1 hour
Doji
Type : Neutral
Timeframe : 1 hour
Bearish harami cross
Type : Bearish
Timeframe : 1 hour
| S3 | S2 | S1 | Price | R1 | R2 | R3 | |
|---|---|---|---|---|---|---|---|
| ProTrendLines | 3,474.35 | 3,514.43 | 3,562.62 | 3,600.13 | 3,607.54 | 3,639.13 | 3,665.95 |
| Change (%) | -3.49% | -2.38% | -1.04% | - | +0.21% | +1.08% | +1.83% |
| Change | -125.78 | -85.70 | -37.51 | - | +7.41 | +39.00 | +65.82 |
| Level | Minor | Intermediate | Intermediate | - | Major | Intermediate | Major |
Pivot points can also be used to set your price objectives. Here is the price situation in relation to pivot points:
| Pivot points | S3 | S2 | S1 | PP | R1 | R2 | R3 |
|---|---|---|---|---|---|---|---|
| Standard | 3,544.71 | 3,558.16 | 3,582.31 | 3,595.76 | 3,619.91 | 3,633.36 | 3,657.51 |
| Camarilla | 3,596.11 | 3,599.56 | 3,603.00 | 3,606.45 | 3,609.90 | 3,613.34 | 3,616.79 |
| Woodie | 3,550.05 | 3,560.84 | 3,587.65 | 3,598.44 | 3,625.25 | 3,636.04 | 3,662.85 |
| Fibonacci | 3,558.16 | 3,572.53 | 3,581.40 | 3,595.76 | 3,610.13 | 3,619.00 | 3,633.36 |
| Pivot points | S3 | S2 | S1 | PP | R1 | R2 | R3 |
|---|---|---|---|---|---|---|---|
| Standard | 3,349.18 | 3,411.77 | 3,513.96 | 3,576.55 | 3,678.74 | 3,741.33 | 3,843.52 |
| Camarilla | 3,570.85 | 3,585.95 | 3,601.06 | 3,616.16 | 3,631.27 | 3,646.37 | 3,661.48 |
| Woodie | 3,368.99 | 3,421.67 | 3,533.77 | 3,586.45 | 3,698.55 | 3,751.23 | 3,863.33 |
| Fibonacci | 3,411.77 | 3,474.71 | 3,513.60 | 3,576.55 | 3,639.49 | 3,678.38 | 3,741.33 |
| Pivot points | S3 | S2 | S1 | PP | R1 | R2 | R3 |
|---|---|---|---|---|---|---|---|
| Standard | 3,285.05 | 3,360.46 | 3,488.31 | 3,563.72 | 3,691.57 | 3,766.98 | 3,894.83 |
| Camarilla | 3,560.26 | 3,578.90 | 3,597.53 | 3,616.16 | 3,634.79 | 3,653.42 | 3,672.06 |
| Woodie | 3,311.27 | 3,373.57 | 3,514.53 | 3,576.83 | 3,717.79 | 3,780.09 | 3,921.05 |
| Fibonacci | 3,360.46 | 3,438.11 | 3,486.08 | 3,563.72 | 3,641.37 | 3,689.34 | 3,766.98 |
Numerical data
The following is the status of technical indicators and moving averages registered at the time this technical analysis was created:
| RSI (14): | 55.66 | |
| MACD (12,26,9): | 3.7100 | |
| Directional Movement: | 7.50 | |
| AROON (14): | 50.00 | |
| DEMA (21): | 3,600.55 | |
| Parabolic SAR (0,02-0,02-0,2): | 3,590.69 | |
| Elder Ray (13): | 4.33 | |
| Super Trend (3,10): | 3,578.21 | |
| Zig ZAG (10): | 3,601.54 | |
| VORTEX (21): | 1.1400 | |
| Stochastique (14,3,5): | 76.18 | |
| TEMA (21): | 3,599.74 | |
| Williams %R (14): | -27.96 | |
| Chande Momentum Oscillator (20): | 9.86 | |
| Repulse (5,40,3): | 0.1200 | |
| ROCnROLL: | 1 | |
| TRIX (15,9): | 0.0100 | |
| Courbe Coppock: | 0.91 |
| MA7: | 3,585.01 | |
| MA20: | 3,554.10 | |
| MA50: | 3,505.80 | |
| MA100: | 3,499.57 | |
| MAexp7: | 3,599.41 | |
| MAexp20: | 3,595.77 | |
| MAexp50: | 3,586.98 | |
| MAexp100: | 3,572.70 | |
| Price / MA7: | +0.42% | |
| Price / MA20: | +1.30% | |
| Price / MA50: | +2.69% | |
| Price / MA100: | +2.87% | |
| Price / MAexp7: | +0.02% | |
| Price / MAexp20: | +0.12% | |
| Price / MAexp50: | +0.37% | |
| Price / MAexp100: | +0.77% |