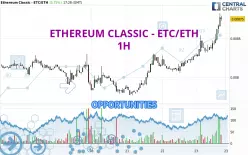
Londinia Opportunities Analyses - 01/23/2025 (GMT) ETHEREUM CLASSIC - ETC/ETH - 1H
-
ETH
(-)
-
Real time data - CoinMarketCap
| Type: | Cryptocurrencies |
| Ticker: | ETCETH |
| ISIN: |
- Cryptocurrencies
- Timeframe : 1H
- - Analysis generated on
- Status : INVALID
Summary of the analysis
Trends
Short term:
Strongly bullish
Underlying:
Strongly bullish
Technical indicators
89%
6%
6%
My opinion
Bullish above 0.008625 ETH
My targets
0.009009 ETH (+2.96%)
0.009821 ETH (+12.24%)
My analysis
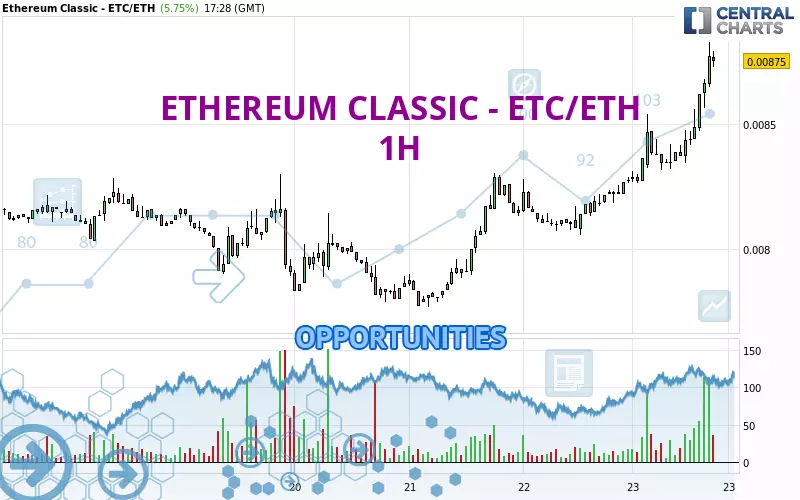
ETHEREUM CLASSIC - ETC/ETH is part of a very strong bullish trend. Traders may consider trading only long positions (at the time of purchase) as long as the price remains well above 0.008625 ETH. The next resistance located at 0.009009 ETH is the next bullish objective to be reached. A bullish break in this resistance would boost the bullish momentum. The bullish movement could then continue towards the next resistance located at 0.009821 ETH. After this resistance, buyers could then target 0.011510 ETH. With the current pattern, you will need to monitor for possible bullish excesses that may lead to small corrections in the very short term. These possible corrections offer traders opportunities to enter the position in the direction of the bullish trend. Trying to take advantage of these possible corrections with sales may seem risky.
Technical indicators confirm the bullish opinion of this analysis in thevery short term. However, be careful of excessive bullish movements. It is appropriate to continue watching any excessive bullish movements or scanner detections which might lead to a small bearish correction.
Force
0
10
8.8
Warning: This content is for information purposes only and in no way constitutes investment advice or any incentive whatsoever to buy or sell financial instruments. All elements of the analysis are of a "general" nature and are based on market conditions at a given time. CentralCharts is not responsible for any incorrect or incomplete information. Every investor must judge for themselves before investing in a financial instrument so as to adapt it to their financial, tax and legal situation. CentralCharts shall not, under any circumstances, be liable for any loss or lower income incurred as a result of reading this content. Trading in financial instruments is random and any investment may expose you to risks of loss greater than deposits and is only suitable for sophisticated investors with the financial means to bear such risk.
Additional analysis
Quotes
The ETHEREUM CLASSIC - ETC/ETH price is 0.008750 ETH. The price has increased by +5.75% since the last closing and was between 0.008262 ETH and 0.008824 ETH. This implies that the price is at +5.91% from its lowest and at -0.84% from its highest.0.008262
0.008824
0.008750
Here is a more detailed summary of the historical variations registered by ETHEREUM CLASSIC - ETC/ETH:
New HIGH record (1st january)
Type : Bullish
Timeframe : Weekly
New HIGH record (1 month)
Type : Bullish
Timeframe : Weekly
Technical
A technical analysis in 1H of this ETHEREUM CLASSIC - ETC/ETH chart shows a strongly bullish trend. The signals given by the moving averages are 92.86% bullish. This strong bullish trend is confirmed by the strong signals currently being given by short-term moving averages. There is no crossing of moving average by the price or crossing of moving averages between themselves.
Technical indicators are strongly bullish, suggesting that the price increase should continue.
Central Indicators, the scanner specialised in technical indicators, has identified these signals:
Pivot points : price is over resistance 1
Type : Neutral
Timeframe : Weekly
Pivot points : price is over resistance 3
Type : Neutral
Timeframe : 1 hour
No signals are given by Central Patterns, a market scanner specialised in chart patterns, resistances and supports.
For a small setback in the very short term, the Central Candlesticks scanner currently notes the presence of this bearish pattern in Japanese candlesticks:
Bearish harami
Type : Bearish
Timeframe : 1 hour
Bearish harami cross
Type : Bearish
Timeframe : 1 hour
ProTrendLines
S3
S2
S1
R1
R2
R3
Price
| S3 | S2 | S1 | Price | R1 | R2 | R3 | |
|---|---|---|---|---|---|---|---|
| ProTrendLines | 0.008057 | 0.008303 | 0.008625 | 0.008750 | 0.009009 | 0.009821 | 0.011510 |
| Change (%) | -7.92% | -5.11% | -1.43% | - | +2.96% | +12.24% | +31.54% |
| Change | -0.000693 | -0.000447 | -0.000125 | - | +0.000259 | +0.001071 | +0.002760 |
| Level | Intermediate | Intermediate | Major | - | Minor | Major | Intermediate |
Pivot points can also be used to set your price objectives. Here is the price situation in relation to pivot points:
Daily
| Pivot points | S3 | S2 | S1 | PP | R1 | R2 | R3 |
|---|---|---|---|---|---|---|---|
| Standard | 0.007896 | 0.007977 | 0.008125 | 0.008206 | 0.008354 | 0.008435 | 0.008583 |
| Camarilla | 0.008211 | 0.008232 | 0.008253 | 0.008274 | 0.008295 | 0.008316 | 0.008337 |
| Woodie | 0.007931 | 0.007994 | 0.008160 | 0.008223 | 0.008389 | 0.008452 | 0.008618 |
| Fibonacci | 0.007977 | 0.008064 | 0.008118 | 0.008206 | 0.008293 | 0.008347 | 0.008435 |
Weekly
| Pivot points | S3 | S2 | S1 | PP | R1 | R2 | R3 |
|---|---|---|---|---|---|---|---|
| Standard | 0.006895 | 0.007223 | 0.007681 | 0.008009 | 0.008467 | 0.008795 | 0.009253 |
| Camarilla | 0.007922 | 0.007994 | 0.008066 | 0.008138 | 0.008210 | 0.008282 | 0.008354 |
| Woodie | 0.006959 | 0.007256 | 0.007745 | 0.008042 | 0.008531 | 0.008828 | 0.009317 |
| Fibonacci | 0.007223 | 0.007524 | 0.007709 | 0.008009 | 0.008310 | 0.008495 | 0.008795 |
Monthly
| Pivot points | S3 | S2 | S1 | PP | R1 | R2 | R3 |
|---|---|---|---|---|---|---|---|
| Standard | 0.004050 | 0.005746 | 0.006624 | 0.008320 | 0.009198 | 0.010894 | 0.011772 |
| Camarilla | 0.006794 | 0.007030 | 0.007266 | 0.007502 | 0.007738 | 0.007974 | 0.008210 |
| Woodie | 0.003641 | 0.005542 | 0.006215 | 0.008116 | 0.008789 | 0.010690 | 0.011363 |
| Fibonacci | 0.005746 | 0.006729 | 0.007337 | 0.008320 | 0.009303 | 0.009911 | 0.010894 |
Numerical data
The following is the status of technical indicators and moving averages registered at the time this technical analysis was created:
Technical indicators
Moving averages
| RSI (14): | 80.56 | |
| MACD (12,26,9): | 0.0001 | |
| Directional Movement: | 41.051674 | |
| AROON (14): | 71.428572 | |
| DEMA (21): | 0.008619 | |
| Parabolic SAR (0,02-0,02-0,2): | 0.008391 | |
| Elder Ray (13): | 0.000225 | |
| Super Trend (3,10): | 0.008487 | |
| Zig ZAG (10): | 0.008759 | |
| VORTEX (21): | 1.3081 | |
| Stochastique (14,3,5): | 90.80 | |
| TEMA (21): | 0.008678 | |
| Williams %R (14): | -13.78 | |
| Chande Momentum Oscillator (20): | 0.000374 | |
| Repulse (5,40,3): | 1.9610 | |
| ROCnROLL: | 1 | |
| TRIX (15,9): | 0.1592 | |
| Courbe Coppock: | 6.42 |
| MA7: | 0.008174 | |
| MA20: | 0.007927 | |
| MA50: | 0.008110 | |
| MA100: | 0.007977 | |
| MAexp7: | 0.008617 | |
| MAexp20: | 0.008460 | |
| MAexp50: | 0.008297 | |
| MAexp100: | 0.008183 | |
| Price / MA7: | +7.05% | |
| Price / MA20: | +10.38% | |
| Price / MA50: | +7.89% | |
| Price / MA100: | +9.69% | |
| Price / MAexp7: | +1.54% | |
| Price / MAexp20: | +3.43% | |
| Price / MAexp50: | +5.46% | |
| Price / MAexp100: | +6.93% |
Quotes :
-
Real time data
-
Cryptocompare