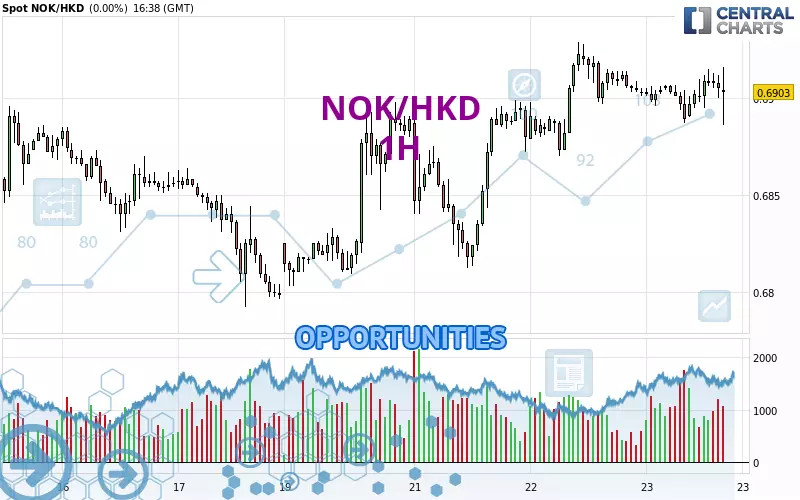
Londinia Opportunities Analyses - 01/23/2025 (GMT) NOK/HKD - 1H
- FX/Indices
- Timeframe : 1H
- - Analysis generated on
- Status : TARGET REACHED
Summary of the analysis

Additional analysis
Quotes
The NOK/HKD rating is 0.6913 HKD. The price registered an increase of +0.15% on the session with the lowest point at 0.6886 HKD and the highest point at 0.6915 HKD. The deviation from the price is +0.39% for the low point and -0.03% for the high point.A bearish opening was detected by the Central Gaps scanner. Sellers are trying to impose a bearish trend in the very short term.
Bearish opening
Type : Bearish
Timeframe : Openning
A study of price movements over other periods shows the following variations:
Near a new LOW record (1 year)
Type : Bearish
Timeframe : Weekly
Near a new LOW record (1st january)
Type : Bearish
Timeframe : Weekly
Near a new LOW record (1 month)
Type : Bearish
Timeframe : Weekly
Technical
Technical analysis of NOK/HKD in 1H shows a strongly overall bullish trend. The signals given by moving averages are 89.29% bullish. This strongly bullish trend seems to be running out of steam given the signals being given by short-term moving averages. The Central Indicators market scanner is currently detecting a bearish signal that could impact this trend:
Bearish price crossover with adaptative moving average 20
Type : Bearish
Timeframe : 1 hour
An assessment of technical indicators shows a slightly bullish signal.
Central Indicators, the detector scanner for these technical indicators has recently detected several signals:
Pivot points : price is over resistance 1
Type : Neutral
Timeframe : Weekly
Parabolic SAR indicator bearish reversal
Type : Bearish
Timeframe : 1 hour
Momentum indicator is back under 0
Type : Bearish
Timeframe : 1 hour
An analysis of the price chart with the Central Patterns scanner (detector of chart patterns and resistances and supports) shows several results that can have an impact on the price change:
Near horizontal resistance
Type : Bearish
Timeframe : 1 hour
Resistance of channel is broken
Type : Bullish
Timeframe : 1 hour
Central Candlesticks, the scanner specialised in Japanese candlesticks, detects a bullish signal that could support the hypothesis of a small rebound in the very short term:
Bullish engulfing lines
Type : Bullish
Timeframe : 1 hour
| S3 | S2 | S1 | Price | R1 | R2 | R3 | |
|---|---|---|---|---|---|---|---|
| ProTrendLines | 0.6839 | 0.6881 | 0.6897 | 0.6913 | 0.6914 | 0.6929 | 0.6977 |
| Change (%) | -1.07% | -0.46% | -0.23% | - | +0.01% | +0.23% | +0.93% |
| Change | -0.0074 | -0.0032 | -0.0016 | - | +0.0001 | +0.0016 | +0.0064 |
| Level | Minor | Minor | Major | - | Minor | Major | Minor |
Attention could also be paid to pivot points to set price objectives:
| Pivot points | S3 | S2 | S1 | PP | R1 | R2 | R3 |
|---|---|---|---|---|---|---|---|
| Standard | 0.6813 | 0.6842 | 0.6872 | 0.6901 | 0.6931 | 0.6960 | 0.6990 |
| Camarilla | 0.6887 | 0.6892 | 0.6898 | 0.6903 | 0.6908 | 0.6914 | 0.6919 |
| Woodie | 0.6815 | 0.6842 | 0.6874 | 0.6901 | 0.6933 | 0.6960 | 0.6992 |
| Fibonacci | 0.6842 | 0.6864 | 0.6878 | 0.6901 | 0.6923 | 0.6937 | 0.6960 |
| Pivot points | S3 | S2 | S1 | PP | R1 | R2 | R3 |
|---|---|---|---|---|---|---|---|
| Standard | 0.6594 | 0.6674 | 0.6736 | 0.6816 | 0.6878 | 0.6958 | 0.7020 |
| Camarilla | 0.6759 | 0.6772 | 0.6785 | 0.6798 | 0.6811 | 0.6824 | 0.6837 |
| Woodie | 0.6585 | 0.6670 | 0.6727 | 0.6812 | 0.6869 | 0.6954 | 0.7011 |
| Fibonacci | 0.6674 | 0.6728 | 0.6762 | 0.6816 | 0.6870 | 0.6904 | 0.6958 |
| Pivot points | S3 | S2 | S1 | PP | R1 | R2 | R3 |
|---|---|---|---|---|---|---|---|
| Standard | 0.6408 | 0.6589 | 0.6706 | 0.6887 | 0.7004 | 0.7185 | 0.7302 |
| Camarilla | 0.6741 | 0.6768 | 0.6796 | 0.6823 | 0.6850 | 0.6878 | 0.6905 |
| Woodie | 0.6376 | 0.6573 | 0.6674 | 0.6871 | 0.6972 | 0.7169 | 0.7270 |
| Fibonacci | 0.6589 | 0.6703 | 0.6773 | 0.6887 | 0.7001 | 0.7071 | 0.7185 |
Numerical data
The following is the status of technical indicators and moving averages registered at the time this technical analysis was created:
| RSI (14): | 57.04 | |
| MACD (12,26,9): | 0.0002 | |
| Directional Movement: | -5.4748 | |
| AROON (14): | 35.7143 | |
| DEMA (21): | 0.6907 | |
| Parabolic SAR (0,02-0,02-0,2): | 0.6892 | |
| Elder Ray (13): | 0.0003 | |
| Super Trend (3,10): | 0.6882 | |
| Zig ZAG (10): | 0.6905 | |
| VORTEX (21): | 0.9647 | |
| Stochastique (14,3,5): | 70.24 | |
| TEMA (21): | 0.6903 | |
| Williams %R (14): | -39.29 | |
| Chande Momentum Oscillator (20): | -0.0001 | |
| Repulse (5,40,3): | -0.0978 | |
| ROCnROLL: | -1 | |
| TRIX (15,9): | 0.0037 | |
| Courbe Coppock: | 0.02 |
| MA7: | 0.6872 | |
| MA20: | 0.6848 | |
| MA50: | 0.6928 | |
| MA100: | 0.7074 | |
| MAexp7: | 0.6904 | |
| MAexp20: | 0.6903 | |
| MAexp50: | 0.6894 | |
| MAexp100: | 0.6879 | |
| Price / MA7: | +0.60% | |
| Price / MA20: | +0.95% | |
| Price / MA50: | -0.22% | |
| Price / MA100: | -2.28% | |
| Price / MAexp7: | +0.13% | |
| Price / MAexp20: | +0.14% | |
| Price / MAexp50: | +0.28% | |
| Price / MAexp100: | +0.49% |