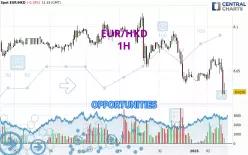
Londinia Opportunities Analyses - 01/02/2025 (GMT) EUR/HKD - 1H
- FX/Indices
- Timeframe : 1H
- - Analysis generated on
- Status : TARGET REACHED
Summary of the analysis

Additional analysis
Quotes
The EUR/HKD price is 8.0266 HKD. The price is lower by -0.18% since the last closing and was traded between 8.0219 HKD and 8.0660 HKD over the period. The price is currently at +0.06% from its lowest and -0.49% from its highest.A study of price movements over other periods shows the following variations:
New LOW record (1 year)
Type : Bearish
Timeframe : Weekly
Near a new HIGH record (1st january)
Type : Bullish
Timeframe : Weekly
Near a new HIGH record (1 month)
Type : Bullish
Timeframe : Weekly
New LOW record (1 month)
Type : Bearish
Timeframe : Weekly
Technical
Technical analysis of this 1H chart of EUR/HKD indicates that the overall trend is strongly bearish. The signals given by moving averages are 92.86% bearish. This strong bearish trend is confirmed by the strong signals currently being given by short-term moving averages. The Central Indicators market scanner is currently detecting a bearish signal that could impact this trend:
Bearish trend reversal : Moving Average 20
Type : Bearish
Timeframe : 1 hour
Technical indicators are strongly bearish, suggesting that the price decline is expected to continue.
But beware of excesses. The Central Indicators scanner currently detects this:
CCI indicator is oversold : under -100
Type : Neutral
Timeframe : 1 hour
Previous candle closed under Bollinger bands
Type : Neutral
Timeframe : 1 hour
Williams %R indicator is oversold : under -80
Type : Neutral
Timeframe : 1 hour
Pivot points : price is under support 3
Type : Neutral
Timeframe : 1 hour
Pivot points : price is under support 3
Type : Neutral
Timeframe : Weekly
Central Patterns, the scanner specializing in chart patterns, did not identify any signals.
For a small rebound in the very short term, the Central Candlesticks scanner currently notes the presence of this bullish pattern in Japanese candlesticks:
Bullish harami
Type : Bullish
Timeframe : 1 hour
| S2 | S1 | Price | R1 | R2 | R3 | |
|---|---|---|---|---|---|---|
| ProTrendLines | 7.5318 | 7.9500 | 8.0266 | 8.0384 | 8.0537 | 8.0700 |
| Change (%) | -6.16% | -0.95% | - | +0.15% | +0.34% | +0.54% |
| Change | -0.4948 | -0.0766 | - | +0.0118 | +0.0271 | +0.0434 |
| Level | Major | Minor | - | Intermediate | Minor | Major |
To determine price objectives, it is also possible to use the pivot points. Here is the price position in relation to pivot points:
| Pivot points | S3 | S2 | S1 | PP | R1 | R2 | R3 |
|---|---|---|---|---|---|---|---|
| Standard | 8.0277 | 8.0330 | 8.0371 | 8.0424 | 8.0465 | 8.0518 | 8.0559 |
| Camarilla | 8.0385 | 8.0394 | 8.0402 | 8.0411 | 8.0420 | 8.0428 | 8.0437 |
| Woodie | 8.0270 | 8.0327 | 8.0364 | 8.0421 | 8.0458 | 8.0515 | 8.0552 |
| Fibonacci | 8.0330 | 8.0366 | 8.0388 | 8.0424 | 8.0460 | 8.0482 | 8.0518 |
| Pivot points | S3 | S2 | S1 | PP | R1 | R2 | R3 |
|---|---|---|---|---|---|---|---|
| Standard | 8.0097 | 8.0374 | 8.0652 | 8.0929 | 8.1207 | 8.1484 | 8.1762 |
| Camarilla | 8.0778 | 8.0829 | 8.0880 | 8.0931 | 8.0982 | 8.1033 | 8.1084 |
| Woodie | 8.0099 | 8.0374 | 8.0654 | 8.0929 | 8.1209 | 8.1484 | 8.1764 |
| Fibonacci | 8.0374 | 8.0586 | 8.0717 | 8.0929 | 8.1141 | 8.1272 | 8.1484 |
| Pivot points | S3 | S2 | S1 | PP | R1 | R2 | R3 |
|---|---|---|---|---|---|---|---|
| Standard | 7.7291 | 7.8821 | 7.9623 | 8.1153 | 8.1955 | 8.3485 | 8.4287 |
| Camarilla | 7.9784 | 7.9998 | 8.0211 | 8.0425 | 8.0639 | 8.0853 | 8.1066 |
| Woodie | 7.6927 | 7.8639 | 7.9259 | 8.0971 | 8.1591 | 8.3303 | 8.3923 |
| Fibonacci | 7.8821 | 7.9712 | 8.0262 | 8.1153 | 8.2044 | 8.2594 | 8.3485 |
Numerical data
The following are the details of the technical indicators and moving averages that were collected to generate this technical analysis:
| RSI (14): | 33.48 | |
| MACD (12,26,9): | -0.0043 | |
| Directional Movement: | -17.8894 | |
| AROON (14): | -42.8571 | |
| DEMA (21): | 8.0435 | |
| Parabolic SAR (0,02-0,02-0,2): | 8.0636 | |
| Elder Ray (13): | -0.0198 | |
| Super Trend (3,10): | 8.0624 | |
| Zig ZAG (10): | 8.0330 | |
| VORTEX (21): | 0.9084 | |
| Stochastique (14,3,5): | 25.19 | |
| TEMA (21): | 8.0454 | |
| Williams %R (14): | -71.20 | |
| Chande Momentum Oscillator (20): | -0.0057 | |
| Repulse (5,40,3): | -0.1529 | |
| ROCnROLL: | 2 | |
| TRIX (15,9): | -0.0047 | |
| Courbe Coppock: | 0.08 |
| MA7: | 8.0655 | |
| MA20: | 8.1202 | |
| MA50: | 8.2199 | |
| MA100: | 8.4079 | |
| MAexp7: | 8.0431 | |
| MAexp20: | 8.0485 | |
| MAexp50: | 8.0579 | |
| MAexp100: | 8.0675 | |
| Price / MA7: | -0.48% | |
| Price / MA20: | -1.15% | |
| Price / MA50: | -2.35% | |
| Price / MA100: | -4.54% | |
| Price / MAexp7: | -0.21% | |
| Price / MAexp20: | -0.27% | |
| Price / MAexp50: | -0.39% | |
| Price / MAexp100: | -0.51% |