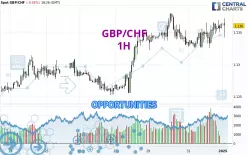
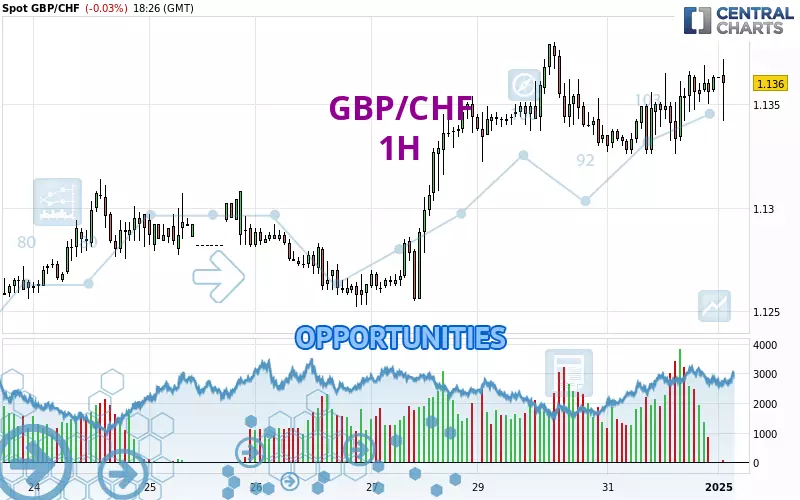
Londinia Opportunities Analyses - 01/01/2025 (GMT) GBP/CHF - 1H
- FX/Indices
- Timeframe : 1H
- - Analysis generated on
- Status : INVALID
Summary of the analysis
Additional analysis
Quotes
The GBP/CHF price is 1.1360 CHF. The price registered a decrease of -0.03% on the session and was between 1.1342 CHF and 1.1372 CHF. This implies that the price is at +0.16% from its lowest and at -0.11% from its highest.Here is a more detailed summary of the historical variations registered by GBP/CHF:
Near a new HIGH record (1 year)
Type : Bullish
Timeframe : Weekly
Near a new HIGH record (1st january)
Type : Bullish
Timeframe : Weekly
Near a new LOW record (1 month)
Type : Bearish
Timeframe : Weekly
Technical
Technical analysis of this 1H chart of GBP/CHF indicates that the overall trend is strongly bullish. The signals given by the moving averages are 92.86% bullish. This strong bullish trend is confirmed by the strong signals currently being given by short-term moving averages. The Central Indicators market scanner is currently detecting several bearish signals that could impact this trend:
Bearish price crossover with Moving Average 20
Type : Bearish
Timeframe : 1 hour
Bearish price crossover with Moving Average 50
Type : Bearish
Timeframe : 1 hour
Bearish price crossover with adaptative moving average 20
Type : Bearish
Timeframe : 1 hour
The probability of a further increase is high given the direction of the technical indicators.
Central Indicators, the detector scanner for these technical indicators recently detected a signal:
Price is back under the pivot point
Type : Bearish
Timeframe : 1 hour
An analysis of the price chart with the Central Patterns scanner (detector of chart patterns and resistances and supports) shows a result that can have an impact on the price change:
Near resistance of channel
Type : Bearish
Timeframe : 1 hour
The Central Candlesticks scanner, specialised in Japanese candlesticks, did not identify any signals.
| S3 | S2 | S1 | Price | R1 | R2 | R3 | |
|---|---|---|---|---|---|---|---|
| ProTrendLines | 1.1252 | 1.1326 | 1.1346 | 1.1360 | 1.1380 | 1.1458 | 1.1681 |
| Change (%) | -0.95% | -0.30% | -0.12% | - | +0.18% | +0.86% | +2.83% |
| Change | -0.0108 | -0.0034 | -0.0014 | - | +0.0020 | +0.0098 | +0.0321 |
| Level | Intermediate | Major | Major | - | Intermediate | Major | Major |
Pivot points can also be used to set your price objectives. Here is the price situation in relation to pivot points:
| Pivot points | S3 | S2 | S1 | PP | R1 | R2 | R3 |
|---|---|---|---|---|---|---|---|
| Standard | 1.1293 | 1.1310 | 1.1336 | 1.1353 | 1.1379 | 1.1396 | 1.1422 |
| Camarilla | 1.1351 | 1.1355 | 1.1359 | 1.1363 | 1.1367 | 1.1371 | 1.1375 |
| Woodie | 1.1299 | 1.1312 | 1.1342 | 1.1355 | 1.1385 | 1.1398 | 1.1428 |
| Fibonacci | 1.1310 | 1.1326 | 1.1336 | 1.1353 | 1.1369 | 1.1379 | 1.1396 |
| Pivot points | S3 | S2 | S1 | PP | R1 | R2 | R3 |
|---|---|---|---|---|---|---|---|
| Standard | 1.1089 | 1.1144 | 1.1244 | 1.1299 | 1.1399 | 1.1454 | 1.1554 |
| Camarilla | 1.1301 | 1.1316 | 1.1330 | 1.1344 | 1.1358 | 1.1372 | 1.1387 |
| Woodie | 1.1112 | 1.1155 | 1.1267 | 1.1310 | 1.1422 | 1.1465 | 1.1577 |
| Fibonacci | 1.1144 | 1.1203 | 1.1240 | 1.1299 | 1.1358 | 1.1395 | 1.1454 |
| Pivot points | S3 | S2 | S1 | PP | R1 | R2 | R3 |
|---|---|---|---|---|---|---|---|
| Standard | 1.1004 | 1.1088 | 1.1226 | 1.1310 | 1.1448 | 1.1532 | 1.1670 |
| Camarilla | 1.1302 | 1.1322 | 1.1343 | 1.1363 | 1.1383 | 1.1404 | 1.1424 |
| Woodie | 1.1030 | 1.1102 | 1.1252 | 1.1324 | 1.1474 | 1.1546 | 1.1696 |
| Fibonacci | 1.1088 | 1.1173 | 1.1226 | 1.1310 | 1.1395 | 1.1448 | 1.1532 |
Numerical data
The following is the status of technical indicators and moving averages registered at the time this technical analysis was created:
| RSI (14): | 58.36 | |
| MACD (12,26,9): | 0.0006 | |
| Directional Movement: | 7.4616 | |
| AROON (14): | 78.5714 | |
| DEMA (21): | 1.1358 | |
| Parabolic SAR (0,02-0,02-0,2): | 1.1333 | |
| Elder Ray (13): | 0.0008 | |
| Super Trend (3,10): | 1.1322 | |
| Zig ZAG (10): | 1.1363 | |
| VORTEX (21): | 1.0978 | |
| Stochastique (14,3,5): | 80.62 | |
| TEMA (21): | 1.1360 | |
| Williams %R (14): | -13.95 | |
| Chande Momentum Oscillator (20): | 0.0016 | |
| Repulse (5,40,3): | 0.0538 | |
| ROCnROLL: | 1 | |
| TRIX (15,9): | 0.0045 | |
| Courbe Coppock: | 0.32 |
| MA7: | 1.1317 | |
| MA20: | 1.1283 | |
| MA50: | 1.1248 | |
| MA100: | 1.1225 | |
| MAexp7: | 1.1359 | |
| MAexp20: | 1.1352 | |
| MAexp50: | 1.1341 | |
| MAexp100: | 1.1326 | |
| Price / MA7: | +0.38% | |
| Price / MA20: | +0.68% | |
| Price / MA50: | +1.00% | |
| Price / MA100: | +1.20% | |
| Price / MAexp7: | +0.01% | |
| Price / MAexp20: | +0.07% | |
| Price / MAexp50: | +0.17% | |
| Price / MAexp100: | +0.30% |
News
The last news published on GBP/CHF at the time of the generation of this analysis was as follows:
-
 GBP/CHF Forecast - Can the Pound Continue to Climb? (December 23, 2024)
-
GBP/CHF Forecast December 6, 2024
-
GBP/CHF Forecast November 1, 2024
-
GBP/CHF Forecast October 15, 2024
-
GBP/CHF Forecast September 26, 2024