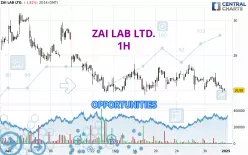
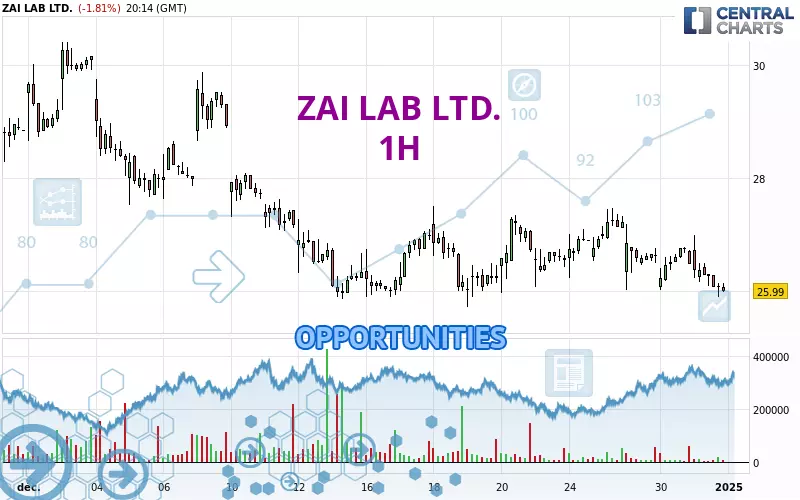
Londinia Opportunities Analyses - 12/31/2024 (GMT) ZAI LAB LTD. - 1H
I am delighted to see that my first price objective has been achieved. I hope you've taken advantage of it.
- U.S. Stocks
- Timeframe : 1H
- - Analysis generated on
- Status : TARGET REACHED
Summary of the analysis
Trends
Short term:
Strongly bearish
Underlying:
Strongly bearish
Technical indicators
11%
78%
11%
My opinion
Bearish under 26.31 USD
My targets
25.87 USD (-1.03%)
25.17 USD (-3.71%)
My analysis
The bearish trend is currently very strong for ZAI LAB LTD.. As long as the price remains below the resistance at 26.31 USD, you could try to take advantage of the bearish rally. The first bearish objective is located at 25.87 USD. The bearish momentum would be revived by a break in this support. Sellers would then use the next support located at 25.17 USD as an objective. Crossing it would then enable sellers to target 22.45 USD. Be careful, given the powerful bearish rally underway, excesses could lead to a short-term rebound. If this is the case, remember that trading against the trend may be riskier. It would seem more appropriate to wait for a signal indicating reversal of the trend.
Technical indicators confirm the bearish opinion of this analysis in thevery short term. However, be careful of excessive bearish movements. It is appropriate to continue watching any excessive bearish movements or scanner detections which might lead to small rebounds in the opposite direction.
Force
0
10
8.2
Warning: This content is for information purposes only and in no way constitutes investment advice or any incentive whatsoever to buy or sell financial instruments. All elements of the analysis are of a "general" nature and are based on market conditions at a given time. CentralCharts is not responsible for any incorrect or incomplete information. Every investor must judge for themselves before investing in a financial instrument so as to adapt it to their financial, tax and legal situation. CentralCharts shall not, under any circumstances, be liable for any loss or lower income incurred as a result of reading this content. Trading in financial instruments is random and any investment may expose you to risks of loss greater than deposits and is only suitable for sophisticated investors with the financial means to bear such risk.
Additional analysis
Quotes
ZAI LAB LTD. rating 26.14 USD. The price registered a decrease of -1.25% on the session and was traded between 25.89 USD and 26.98 USD over the period. The price is currently at +0.97% from its lowest and -3.11% from its highest.25.89
26.98
26.14
A study of price movements over other periods shows the following variations:
Near a new LOW record (1 month)
Type : Bearish
Timeframe : Weekly
Technical
A technical analysis in 1H of this ZAI LAB LTD. chart shows a sharp bearish trend. 92.86% of the signals given by moving averages are bearish. This strongly bearish trend is supported by the strong bearish signals given by short-term moving averages. The Central Indicators scanner detects a bearish signal on moving averages that could impact this trend:
Bearish trend reversal : Moving Average 50
Type : Bearish
Timeframe : 1 hour
The probability of a further decline is high given the direction of the technical indicators.
Central Indicators, the scanner specialised in technical indicators, has identified this signal:
Pivot points : price is under support 1
Type : Neutral
Timeframe : 1 hour
Central Patterns, the market scanner focusing on chart patterns, resistances and supports found this result:
Support of channel is broken
Type : Bearish
Timeframe : 1 hour
Central Candlesticks, the scanner specialised in Japanese candlesticks, detects a bearish signal that could support the hypothesis of a small drop in the very short term:
Three black crows
Type : Bearish
Timeframe : 1 hour
ProTrendLines
S3
S2
S1
R1
R2
R3
Price
| S3 | S2 | S1 | Price | R1 | R2 | R3 | |
|---|---|---|---|---|---|---|---|
| ProTrendLines | 22.45 | 25.17 | 25.87 | 26.14 | 26.31 | 26.97 | 27.48 |
| Change (%) | -14.12% | -3.71% | -1.03% | - | +0.65% | +3.18% | +5.13% |
| Change | -3.69 | -0.97 | -0.27 | - | +0.17 | +0.83 | +1.34 |
| Level | Major | Major | Major | - | Minor | Intermediate | Major |
Attention could also be paid to pivot points to set price objectives:
Daily
| Pivot points | S3 | S2 | S1 | PP | R1 | R2 | R3 |
|---|---|---|---|---|---|---|---|
| Standard | 25.30 | 25.66 | 26.06 | 26.42 | 26.82 | 27.18 | 27.58 |
| Camarilla | 26.26 | 26.33 | 26.40 | 26.47 | 26.54 | 26.61 | 26.68 |
| Woodie | 25.33 | 25.67 | 26.09 | 26.43 | 26.85 | 27.19 | 27.61 |
| Fibonacci | 25.66 | 25.95 | 26.13 | 26.42 | 26.71 | 26.89 | 27.18 |
Weekly
| Pivot points | S3 | S2 | S1 | PP | R1 | R2 | R3 |
|---|---|---|---|---|---|---|---|
| Standard | 24.48 | 25.24 | 25.93 | 26.69 | 27.38 | 28.14 | 28.83 |
| Camarilla | 26.21 | 26.34 | 26.48 | 26.61 | 26.74 | 26.88 | 27.01 |
| Woodie | 24.44 | 25.22 | 25.89 | 26.67 | 27.34 | 28.12 | 28.79 |
| Fibonacci | 25.24 | 25.80 | 26.14 | 26.69 | 27.25 | 27.59 | 28.14 |
Monthly
| Pivot points | S3 | S2 | S1 | PP | R1 | R2 | R3 |
|---|---|---|---|---|---|---|---|
| Standard | 17.34 | 21.10 | 24.97 | 28.73 | 32.60 | 36.36 | 40.23 |
| Camarilla | 26.75 | 27.45 | 28.15 | 28.85 | 29.55 | 30.25 | 30.95 |
| Woodie | 17.41 | 21.13 | 25.04 | 28.76 | 32.67 | 36.39 | 40.30 |
| Fibonacci | 21.10 | 24.01 | 25.81 | 28.73 | 31.64 | 33.44 | 36.36 |
Numerical data
The following is the status of the technical indicators and moving averages at the time of publication of this technical analysis:
Technical indicators
Moving averages
| RSI (14): | 33.01 | |
| MACD (12,26,9): | -0.1600 | |
| Directional Movement: | -12.32 | |
| AROON (14): | -35.71 | |
| DEMA (21): | 26.28 | |
| Parabolic SAR (0,02-0,02-0,2): | 27.00 | |
| Elder Ray (13): | -0.35 | |
| Super Trend (3,10): | 26.91 | |
| Zig ZAG (10): | 26.00 | |
| VORTEX (21): | 0.8000 | |
| Stochastique (14,3,5): | 13.06 | |
| TEMA (21): | 26.14 | |
| Williams %R (14): | -91.74 | |
| Chande Momentum Oscillator (20): | -0.24 | |
| Repulse (5,40,3): | -1.4300 | |
| ROCnROLL: | 2 | |
| TRIX (15,9): | -0.0500 | |
| Courbe Coppock: | 2.75 |
| MA7: | 26.65 | |
| MA20: | 27.16 | |
| MA50: | 28.38 | |
| MA100: | 24.79 | |
| MAexp7: | 26.26 | |
| MAexp20: | 26.45 | |
| MAexp50: | 26.61 | |
| MAexp100: | 26.87 | |
| Price / MA7: | -1.91% | |
| Price / MA20: | -3.76% | |
| Price / MA50: | -7.89% | |
| Price / MA100: | +5.45% | |
| Price / MAexp7: | -0.46% | |
| Price / MAexp20: | -1.17% | |
| Price / MAexp50: | -1.77% | |
| Price / MAexp100: | -2.72% |
Quotes :
-
15 min delayed data
-
Actions NASDAQ
News
The latest news and videos published on ZAI LAB LTD. at the time of the analysis were as follows:
- Zai Lab Announces Third Quarter 2023 Financial Results and Recent Corporate Updates
- Zai Lab Announces Participation in November Investor Conferences
- Zai Lab to Announce Third Quarter 2023 Financial Results and Recent Corporate Updates on November 7, 2023
- Zai Lab Obtains Breakthrough Therapy Designation for Efgartigimod Alfa Injection (Subcutaneous Injection) in Patients with Chronic Inflammatory Demyelinating Polyneuropathy in China
- Zai Lab Announces Breakthrough Therapy Designation Granted for Repotrectinib for Treatment of Patients with NTRK-positive TKI-pretreated advanced solid tumors in China