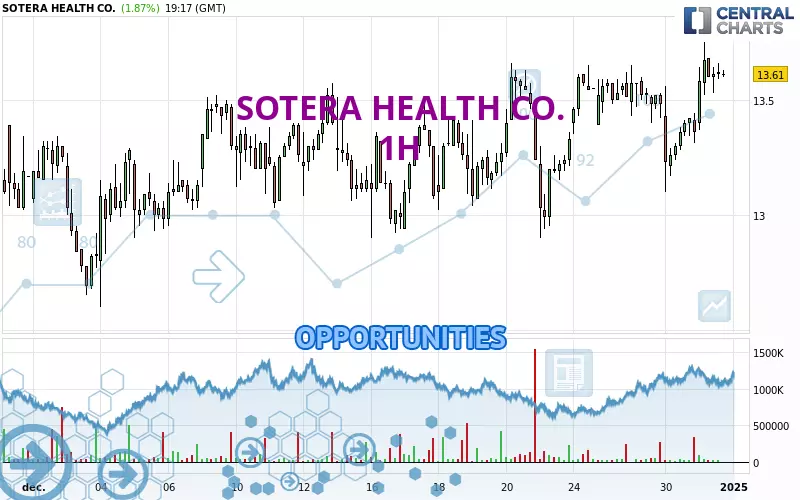
Londinia Opportunities Analyses - 12/31/2024 (GMT) SOTERA HEALTH CO. - 1H
I am delighted to see that my first price objective has been achieved. I hope you've taken advantage of it.
- U.S. Stocks
- Timeframe : 1H
- - Analysis generated on
- Status : TARGET REACHED
Summary of the analysis
Trends
Short term:
Strongly bullish
Underlying:
Strongly bullish
Technical indicators
83%
0%
17%
My opinion
Bullish above 13.39 USD
My targets
13.84 USD (+1.69%)
14.04 USD (+3.16%)
My analysis
All elements being clearly bullish, it would be possible for traders to trade only long positions (at the time of purchase) on SOTERA HEALTH CO. as long as the price remains well above 13.39 USD. The buyers' bullish objective is set at 13.84 USD. A bullish break in this resistance would boost the bullish momentum. The buyers could then target the resistance located at 14.04 USD. If there is any crossing, the next objective would be the resistance located at 14.70 USD. However, beware of bullish excesses that could lead to a possible short-term correction; but this possible correction would not be tradeable.
In the very short term, the general bullish sentiment is confirmed by technical indicators. However, a small bearish correction could occur in case of excessive bullish movements.
Force
0
10
8.8

Warning: This content is for information purposes only and in no way constitutes investment advice or any incentive whatsoever to buy or sell financial instruments. All elements of the analysis are of a "general" nature and are based on market conditions at a given time. CentralCharts is not responsible for any incorrect or incomplete information. Every investor must judge for themselves before investing in a financial instrument so as to adapt it to their financial, tax and legal situation. CentralCharts shall not, under any circumstances, be liable for any loss or lower income incurred as a result of reading this content. Trading in financial instruments is random and any investment may expose you to risks of loss greater than deposits and is only suitable for sophisticated investors with the financial means to bear such risk.
Additional analysis
Quotes
SOTERA HEALTH CO. rating 13.61 USD. The price has increased by +1.87% since the last closing with the lowest point at 13.37 USD and the highest point at 13.75 USD. The deviation from the price is +1.80% for the low point and -1.02% for the high point.13.37
13.75
13.61
The Central Gaps scanner detects a bullish opening. A small advantage for buyers in the very short term.
Bullish opening
Type : Bullish
Timeframe : Openning
A study of price movements over other periods shows the following variations:
New HIGH record (1 month)
Type : Bullish
Timeframe : Weekly
Technical
Technical analysis of this 1H chart of SOTERA HEALTH CO. indicates that the overall trend is strongly bullish. The signals given by the moving averages are 92.86% bullish. This strong bullish trend is confirmed by the strong signals currently being given by short-term moving averages. The Central Indicators scanner does not detect any result on moving averages that would impact this trend.
In fact, according to the parameters integrated into the Central Analyzer system, 15 technical indicators out of 18 analysed are currently bullish. Central Indicators, the detector scanner for these technical indicators recently detected a signal:
Pivot points : price is over resistance 1
Type : Neutral
Timeframe : 1 hour
Central Patterns, the market scanner focusing on chart patterns, resistances and supports found this result:
Near resistance of channel
Type : Bearish
Timeframe : 1 hour
For a small setback in the very short term, the Central Candlesticks scanner currently notes the presence of this bearish pattern in Japanese candlesticks:
Bearish doji star
Type : Bearish
Timeframe : 1 hour
ProTrendLines
S3
S2
S1
R1
R2
R3
Price
| S3 | S2 | S1 | Price | R1 | R2 | R3 | |
|---|---|---|---|---|---|---|---|
| ProTrendLines | 12.50 | 12.99 | 13.39 | 13.61 | 13.65 | 13.84 | 14.04 |
| Change (%) | -8.16% | -4.56% | -1.62% | - | +0.29% | +1.69% | +3.16% |
| Change | -1.11 | -0.62 | -0.22 | - | +0.04 | +0.23 | +0.43 |
| Level | Major | Major | Minor | - | Major | Minor | Minor |
Attention could also be paid to pivot points to set price objectives:
Daily
| Pivot points | S3 | S2 | S1 | PP | R1 | R2 | R3 |
|---|---|---|---|---|---|---|---|
| Standard | 12.66 | 12.88 | 13.12 | 13.34 | 13.58 | 13.80 | 14.04 |
| Camarilla | 13.23 | 13.28 | 13.32 | 13.36 | 13.40 | 13.44 | 13.49 |
| Woodie | 12.67 | 12.89 | 13.13 | 13.35 | 13.59 | 13.81 | 14.05 |
| Fibonacci | 12.88 | 13.06 | 13.16 | 13.34 | 13.52 | 13.62 | 13.80 |
Weekly
| Pivot points | S3 | S2 | S1 | PP | R1 | R2 | R3 |
|---|---|---|---|---|---|---|---|
| Standard | 12.29 | 12.59 | 13.04 | 13.34 | 13.79 | 14.09 | 14.54 |
| Camarilla | 13.27 | 13.34 | 13.41 | 13.48 | 13.55 | 13.62 | 13.69 |
| Woodie | 12.36 | 12.63 | 13.11 | 13.38 | 13.86 | 14.13 | 14.61 |
| Fibonacci | 12.59 | 12.88 | 13.06 | 13.34 | 13.63 | 13.81 | 14.09 |
Monthly
| Pivot points | S3 | S2 | S1 | PP | R1 | R2 | R3 |
|---|---|---|---|---|---|---|---|
| Standard | 7.38 | 9.84 | 11.51 | 13.97 | 15.64 | 18.10 | 19.77 |
| Camarilla | 12.03 | 12.41 | 12.79 | 13.17 | 13.55 | 13.93 | 14.31 |
| Woodie | 6.98 | 9.64 | 11.11 | 13.77 | 15.24 | 17.90 | 19.37 |
| Fibonacci | 9.84 | 11.42 | 12.40 | 13.97 | 15.55 | 16.53 | 18.10 |
Numerical data
The following is the status of the technical indicators and moving averages at the time of publication of this technical analysis:
Technical indicators
Moving averages
| RSI (14): | 58.44 | |
| MACD (12,26,9): | 0.0400 | |
| Directional Movement: | 3.31 | |
| AROON (14): | 57.14 | |
| DEMA (21): | 13.54 | |
| Parabolic SAR (0,02-0,02-0,2): | 13.18 | |
| Elder Ray (13): | 0.11 | |
| Super Trend (3,10): | 13.24 | |
| Zig ZAG (10): | 13.61 | |
| VORTEX (21): | 1.0300 | |
| Stochastique (14,3,5): | 78.46 | |
| TEMA (21): | 13.56 | |
| Williams %R (14): | -21.54 | |
| Chande Momentum Oscillator (20): | 0.13 | |
| Repulse (5,40,3): | 0.3200 | |
| ROCnROLL: | 1 | |
| TRIX (15,9): | 0.0200 | |
| Courbe Coppock: | 0.86 |
| MA7: | 13.44 | |
| MA20: | 13.26 | |
| MA50: | 14.17 | |
| MA100: | 14.98 | |
| MAexp7: | 13.56 | |
| MAexp20: | 13.49 | |
| MAexp50: | 13.43 | |
| MAexp100: | 13.41 | |
| Price / MA7: | +1.26% | |
| Price / MA20: | +2.64% | |
| Price / MA50: | -3.95% | |
| Price / MA100: | -9.15% | |
| Price / MAexp7: | +0.37% | |
| Price / MAexp20: | +0.89% | |
| Price / MAexp50: | +1.34% | |
| Price / MAexp100: | +1.49% |
Quotes :
-
15 min delayed data
-
Actions NASDAQ
News
The latest news and videos published on SOTERA HEALTH CO. at the time of the analysis were as follows:
- Sotera Health to Share Next Chapter of Growth at 2024 Investor Day
- Sotera Health Reports Third-Quarter and Year-to-Date 2024 Results
- Sotera Health Announces Dates for Third-Quarter 2024 Earnings Release and November 2024 Investor Day
- Sotera Health Announces Secondary Offering of Common Stock
- Sotera Health Reports Second-Quarter and First-Half 2024 Results