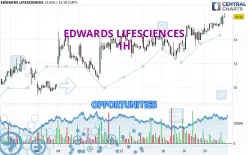
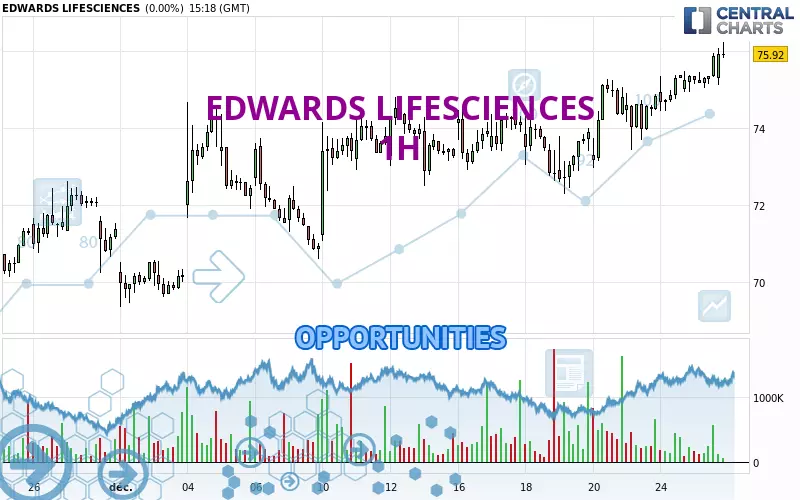
Londinia Opportunities Analyses - 12/27/2024 (GMT) EDWARDS LIFESCIENCES - 1H
- U.S. Stocks
- Timeframe : 1H
- - Analysis generated on
- Status : INVALID
Summary of the analysis
Trends
Short term:
Strongly bullish
Underlying:
Strongly bullish
Technical indicators
78%
0%
22%
My opinion
Bullish above 74.34 USD
My targets
78.94 USD (+3.77%)
82.09 USD (+7.91%)
My analysis
All elements being clearly bullish, it would be possible for traders to trade only long positions (at the time of purchase) on EDWARDS LIFESCIENCES as long as the price remains well above 74.34 USD. The buyers' bullish objective is set at 78.94 USD. A bullish break in this resistance would boost the bullish momentum. The buyers could then target the resistance located at 82.09 USD. If there is any crossing, the next objective would be the resistance located at 90.29 USD. However, beware of bullish excesses that could lead to a possible short-term correction; but this possible correction would not be tradeable.
Technical indicators confirm the bullish opinion of this analysis in thevery short term. However, be careful of excessive bullish movements. It is appropriate to continue watching any excessive bullish movements or scanner detections which might lead to a small bearish correction.
Force
0
10
8.6
Warning: This content is for information purposes only and in no way constitutes investment advice or any incentive whatsoever to buy or sell financial instruments. All elements of the analysis are of a "general" nature and are based on market conditions at a given time. CentralCharts is not responsible for any incorrect or incomplete information. Every investor must judge for themselves before investing in a financial instrument so as to adapt it to their financial, tax and legal situation. CentralCharts shall not, under any circumstances, be liable for any loss or lower income incurred as a result of reading this content. Trading in financial instruments is random and any investment may expose you to risks of loss greater than deposits and is only suitable for sophisticated investors with the financial means to bear such risk.
Additional analysis
Quotes
EDWARDS LIFESCIENCES rating 76.07 USD. On the day, this instrument gained +0.20% and was traded between 75.11 USD and 76.23 USD over the period. The price is currently at +1.28% from its lowest and -0.21% from its highest.75.11
76.23
76.07
Here is a more detailed summary of the historical variations registered by EDWARDS LIFESCIENCES:
New HIGH record (1 month)
Type : Bullish
Timeframe : Weekly
Technical
Technical analysis of EDWARDS LIFESCIENCES in 1H shows a strongly overall bullish trend. 92.86% of the signals given by moving averages are bullish. This strongly bullish trend is supported by the strong bullish signals given by short-term moving averages. The Central Indicators scanner does not detect any result on moving averages that would impact this trend.
The probability of a further increase is high given the direction of the technical indicators.
Central Indicators, the scanner specialised in technical indicators, has identified these signals:
Pivot points : price is over resistance 1
Type : Neutral
Timeframe : Weekly
Price is back over the pivot point
Type : Bullish
Timeframe : 1 hour
Central Patterns, the scanner specializing in chart patterns, did not identify any signals.
The Central Candlesticks scanner which studies Japanese candlesticks did not detect anything.
ProTrendLines
S3
S2
S1
R1
R2
R3
Price
| S3 | S2 | S1 | Price | R1 | R2 | R3 | |
|---|---|---|---|---|---|---|---|
| ProTrendLines | 70.59 | 72.63 | 74.34 | 76.07 | 82.09 | 90.29 | 95.15 |
| Change (%) | -7.20% | -4.52% | -2.27% | - | +7.91% | +18.69% | +25.08% |
| Change | -5.48 | -3.44 | -1.73 | - | +6.02 | +14.22 | +19.08 |
| Level | Intermediate | Minor | Major | - | Major | Minor | Major |
Attention could also be paid to pivot points to set price objectives:
Daily
| Pivot points | S3 | S2 | S1 | PP | R1 | R2 | R3 |
|---|---|---|---|---|---|---|---|
| Standard | 74.21 | 74.57 | 75.24 | 75.60 | 76.27 | 76.63 | 77.30 |
| Camarilla | 75.64 | 75.73 | 75.83 | 75.92 | 76.01 | 76.11 | 76.20 |
| Woodie | 74.38 | 74.65 | 75.41 | 75.68 | 76.44 | 76.71 | 77.47 |
| Fibonacci | 74.57 | 74.96 | 75.20 | 75.60 | 75.99 | 76.23 | 76.63 |
Weekly
| Pivot points | S3 | S2 | S1 | PP | R1 | R2 | R3 |
|---|---|---|---|---|---|---|---|
| Standard | 70.00 | 71.14 | 72.98 | 74.12 | 75.96 | 77.10 | 78.94 |
| Camarilla | 73.99 | 74.26 | 74.54 | 74.81 | 75.08 | 75.36 | 75.63 |
| Woodie | 70.34 | 71.32 | 73.32 | 74.30 | 76.30 | 77.28 | 79.28 |
| Fibonacci | 71.14 | 72.28 | 72.99 | 74.12 | 75.26 | 75.97 | 77.10 |
Monthly
| Pivot points | S3 | S2 | S1 | PP | R1 | R2 | R3 |
|---|---|---|---|---|---|---|---|
| Standard | 58.89 | 61.89 | 66.63 | 69.63 | 74.37 | 77.37 | 82.11 |
| Camarilla | 69.24 | 69.95 | 70.66 | 71.37 | 72.08 | 72.79 | 73.50 |
| Woodie | 59.76 | 62.33 | 67.50 | 70.07 | 75.24 | 77.81 | 82.98 |
| Fibonacci | 61.89 | 64.85 | 66.67 | 69.63 | 72.59 | 74.41 | 77.37 |
Numerical data
The following is the status of the technical indicators and moving averages at the time of publication of this technical analysis:
Technical indicators
Moving averages
| RSI (14): | 67.02 | |
| MACD (12,26,9): | 0.4400 | |
| Directional Movement: | 5.02 | |
| AROON (14): | 85.72 | |
| DEMA (21): | 75.71 | |
| Parabolic SAR (0,02-0,02-0,2): | 74.75 | |
| Elder Ray (13): | 0.54 | |
| Super Trend (3,10): | 74.46 | |
| Zig ZAG (10): | 76.08 | |
| VORTEX (21): | 1.1300 | |
| Stochastique (14,3,5): | 95.01 | |
| TEMA (21): | 75.89 | |
| Williams %R (14): | -0.60 | |
| Chande Momentum Oscillator (20): | 1.35 | |
| Repulse (5,40,3): | 1.5800 | |
| ROCnROLL: | 1 | |
| TRIX (15,9): | 0.0700 | |
| Courbe Coppock: | 2.86 |
| MA7: | 74.82 | |
| MA20: | 73.36 | |
| MA50: | 70.52 | |
| MA100: | 68.97 | |
| MAexp7: | 75.65 | |
| MAexp20: | 75.15 | |
| MAexp50: | 74.50 | |
| MAexp100: | 73.64 | |
| Price / MA7: | +1.67% | |
| Price / MA20: | +3.69% | |
| Price / MA50: | +7.87% | |
| Price / MA100: | +10.29% | |
| Price / MAexp7: | +0.56% | |
| Price / MAexp20: | +1.22% | |
| Price / MAexp50: | +2.11% | |
| Price / MAexp100: | +3.30% |
Quotes :
-
15 min delayed data
-
Actions NYSE
News
The last news published on EDWARDS LIFESCIENCES at the time of the generation of this analysis was as follows:
- Levi & Korsinsky Reminds Edwards Lifesciences Corporation Investors of the Pending Class Action Lawsuit with a Lead Plaintiff Deadline of December 13, 2024 - EW
- FINAL DEADLINE ALERT: Faruqi & Faruqi, LLP Investigates Claims on Behalf of Investors of Edwards Lifesciences Corporation
- The Law Offices of Frank R. Cruz Reminds Investors of Looming Deadline in the Class Action Lawsuit Against Edwards Lifesciences Corporation (EW)
- Faruqi & Faruqi Reminds Edwards Lifesciences Investors of the Pending Class Action Lawsuit with a Lead Plaintiff Deadline of December 13, 2024 - EW
- Edwards Lifesciences Corporation Sued for Securities Law Violations - Investors Should Contact The Gross Law Firm Before December 13, 2024 to Discuss Your Rights - EW