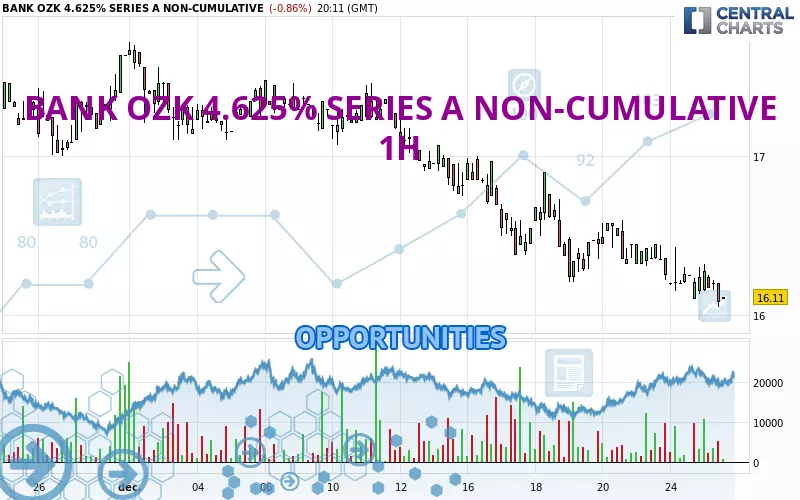
Londinia Opportunities Analyses - 12/26/2024 (GMT) BANK OZK 4.625% SERIES A NON-CUMULATIVE - 1H
- U.S. Stocks
- Timeframe : 1H
- - Analysis generated on
- Status : LEVEL MAINTAINED
Summary of the analysis

Additional analysis
Quotes
BANK OZK 4.625% SERIES A NON-CUMULATIVE rating 16.10 USD. On the day, this instrument lost -0.92% and was traded between 16.05 USD and 16.32 USD over the period. The price is currently at +0.31% from its lowest and -1.35% from its highest.The Central Gaps scanner detects a bearish gap which is a sign that the sellers have taken the lead in the very short term.
Opening Gap DOWN
Type : Bearish
Timeframe : Openning
Here is a more detailed summary of the historical variations registered by BANK OZK 4.625% SERIES A NON-CUMULATIVE:
New LOW record (1 month)
Type : Bearish
Timeframe : Weekly
Technical
A technical analysis in 1H of this BANK OZK 4.625% SERIES A NON-CUMULATIVE chart shows a sharp bearish trend. The signals given by moving averages are 92.86% bearish. This strong bearish trend is confirmed by the strong signals currently being given by short-term moving averages. The Central Indicators market scanner currently does not detect any result that concerns moving averages.
In fact, 14 technical indicators on 18 studied are currently positioned bearish. Caution: the Central Indicators scanner currently detects an excess:
CCI indicator is oversold : under -100
Type : Neutral
Timeframe : 1 hour
Williams %R indicator is oversold : under -80
Type : Neutral
Timeframe : 1 hour
Pivot points : price is under support 1
Type : Neutral
Timeframe : 1 hour
Pivot points : price is under support 1
Type : Neutral
Timeframe : Weekly
Central Patterns, the market scanner focusing on chart patterns, resistances and supports found these results:
Near horizontal support
Type : Bullish
Timeframe : 1 hour
Near support of channel
Type : Bullish
Timeframe : 1 hour
The Central Candlesticks scanner which studies Japanese candlesticks did not detect anything.
| S3 | S2 | S1 | Price | R1 | R2 | R3 | |
|---|---|---|---|---|---|---|---|
| ProTrendLines | 11.60 | 13.32 | 14.95 | 16.10 | 16.18 | 16.60 | 16.84 |
| Change (%) | -27.95% | -17.27% | -7.14% | - | +0.50% | +3.11% | +4.60% |
| Change | -4.50 | -2.78 | -1.15 | - | +0.08 | +0.50 | +0.74 |
| Level | Minor | Minor | Major | - | Intermediate | Minor | Major |
To determine price objectives, it is also possible to use the pivot points. Here is the price position in relation to pivot points:
| Pivot points | S3 | S2 | S1 | PP | R1 | R2 | R3 |
|---|---|---|---|---|---|---|---|
| Standard | 15.83 | 15.98 | 16.12 | 16.27 | 16.41 | 16.56 | 16.70 |
| Camarilla | 16.17 | 16.20 | 16.22 | 16.25 | 16.28 | 16.30 | 16.33 |
| Woodie | 15.82 | 15.98 | 16.11 | 16.27 | 16.40 | 16.56 | 16.69 |
| Fibonacci | 15.98 | 16.09 | 16.16 | 16.27 | 16.38 | 16.45 | 16.56 |
| Pivot points | S3 | S2 | S1 | PP | R1 | R2 | R3 |
|---|---|---|---|---|---|---|---|
| Standard | 15.32 | 15.76 | 16.11 | 16.55 | 16.90 | 17.34 | 17.69 |
| Camarilla | 16.23 | 16.31 | 16.38 | 16.45 | 16.52 | 16.60 | 16.67 |
| Woodie | 15.27 | 15.74 | 16.06 | 16.53 | 16.85 | 17.32 | 17.64 |
| Fibonacci | 15.76 | 16.07 | 16.25 | 16.55 | 16.86 | 17.04 | 17.34 |
| Pivot points | S3 | S2 | S1 | PP | R1 | R2 | R3 |
|---|---|---|---|---|---|---|---|
| Standard | 15.08 | 15.99 | 16.82 | 17.73 | 18.56 | 19.47 | 20.30 |
| Camarilla | 17.16 | 17.32 | 17.48 | 17.64 | 17.80 | 17.96 | 18.12 |
| Woodie | 15.03 | 15.97 | 16.77 | 17.71 | 18.51 | 19.45 | 20.25 |
| Fibonacci | 15.99 | 16.66 | 17.07 | 17.73 | 18.40 | 18.81 | 19.47 |
Numerical data
The following is the status of technical indicators and moving averages registered at the time this technical analysis was created:
| RSI (14): | 35.80 | |
| MACD (12,26,9): | -0.0900 | |
| Directional Movement: | -7.53 | |
| AROON (14): | -92.86 | |
| DEMA (21): | 16.16 | |
| Parabolic SAR (0,02-0,02-0,2): | 16.30 | |
| Elder Ray (13): | -0.11 | |
| Super Trend (3,10): | 16.49 | |
| Zig ZAG (10): | 16.10 | |
| VORTEX (21): | 0.7800 | |
| Stochastique (14,3,5): | 20.77 | |
| TEMA (21): | 16.16 | |
| Williams %R (14): | -87.50 | |
| Chande Momentum Oscillator (20): | -0.25 | |
| Repulse (5,40,3): | -0.3500 | |
| ROCnROLL: | 2 | |
| TRIX (15,9): | -0.0700 | |
| Courbe Coppock: | 2.36 |
| MA7: | 16.35 | |
| MA20: | 16.90 | |
| MA50: | 17.63 | |
| MA100: | 17.56 | |
| MAexp7: | 16.19 | |
| MAexp20: | 16.28 | |
| MAexp50: | 16.46 | |
| MAexp100: | 16.70 | |
| Price / MA7: | -1.53% | |
| Price / MA20: | -4.73% | |
| Price / MA50: | -8.68% | |
| Price / MA100: | -8.31% | |
| Price / MAexp7: | -0.56% | |
| Price / MAexp20: | -1.11% | |
| Price / MAexp50: | -2.19% | |
| Price / MAexp100: | -3.59% |