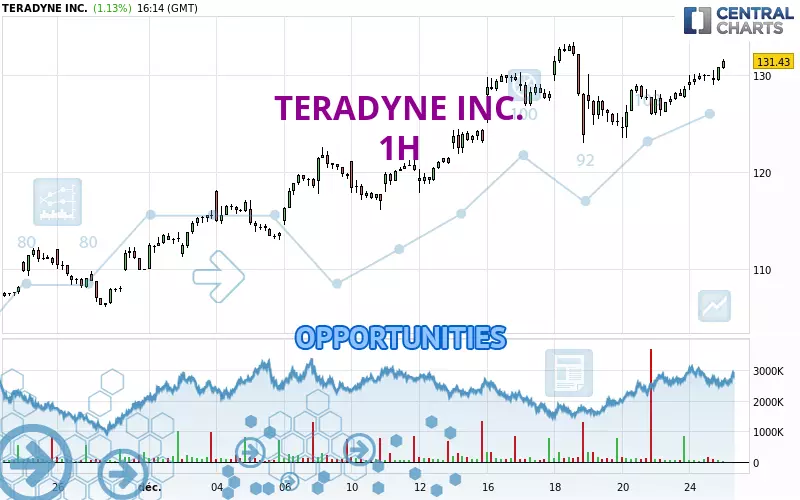
Londinia Opportunities Analyses - 12/26/2024 (GMT) TERADYNE INC. - 1H
- U.S. Stocks
- Timeframe : 1H
- - Analysis generated on
- Status : INVALID
Summary of the analysis
Trends
Short term:
Strongly bullish
Underlying:
Strongly bullish
Technical indicators
78%
6%
17%
My opinion
Bullish above 129.35 USD
My targets
133.34 USD (+1.75%)
141.34 USD (+7.85%)
My analysis
All elements being clearly bullish, it would be possible for traders to trade only long positions (at the time of purchase) on TERADYNE INC. as long as the price remains well above 129.35 USD. The buyers' bullish objective is set at 133.34 USD. A bullish break in this resistance would boost the bullish momentum. The buyers could then target the resistance located at 141.34 USD. If there is any crossing, the next objective would be the resistance located at 151.42 USD. However, beware of bullish excesses that could lead to a possible short-term correction; but this possible correction would not be tradeable.
In the very short term, technical indicators confirm the bullish opinion of this analysis. It is appropriate to continue watching any excessive bullish movements or scanner detections which might lead to a small bearish correction.
Force
0
10
8.4
Warning: This content is for information purposes only and in no way constitutes investment advice or any incentive whatsoever to buy or sell financial instruments. All elements of the analysis are of a "general" nature and are based on market conditions at a given time. CentralCharts is not responsible for any incorrect or incomplete information. Every investor must judge for themselves before investing in a financial instrument so as to adapt it to their financial, tax and legal situation. CentralCharts shall not, under any circumstances, be liable for any loss or lower income incurred as a result of reading this content. Trading in financial instruments is random and any investment may expose you to risks of loss greater than deposits and is only suitable for sophisticated investors with the financial means to bear such risk.
Additional analysis
Quotes
TERADYNE INC. rating 131.05 USD. The price has increased by +0.84% since the last closing with the lowest point at 128.89 USD and the highest point at 131.05 USD. The deviation from the price is +1.68% for the low point and 0% for the high point.128.89
131.05
131.05
Here is a more detailed summary of the historical variations registered by TERADYNE INC.:
Near a new HIGH record (1 month)
Type : Bullish
Timeframe : Weekly
Technical
Technical analysis of TERADYNE INC. in 1H shows a strongly overall bullish trend. 92.86% of the signals given by moving averages are bullish. This strongly bullish trend is supported by the strong bullish signals given by short-term moving averages. An assessment of moving averages reveals a bullish signal that could impact this trend:
Moving Average bullish crossovers : MA20 & MA50
Type : Bullish
Timeframe : 1 hour
The probability of a further increase is high given the direction of the technical indicators.
Other results related to technical indicators were also found by the Central Indicators scanner:
Pivot points : price is over resistance 1
Type : Neutral
Timeframe : 1 hour
Price is back over the pivot point
Type : Bullish
Timeframe : Weekly
The analysis of the price chart with Central Patterns scanners does not return any result.
No result was found by the Central Candlesticks scanner on Japanese candlesticks.
ProTrendLines
S3
S2
S1
R1
R2
R3
Price
| S3 | S2 | S1 | Price | R1 | R2 | R3 | |
|---|---|---|---|---|---|---|---|
| ProTrendLines | 116.46 | 122.78 | 129.35 | 131.05 | 133.34 | 141.34 | 151.42 |
| Change (%) | -11.13% | -6.31% | -1.30% | - | +1.75% | +7.85% | +15.54% |
| Change | -14.59 | -8.27 | -1.70 | - | +2.29 | +10.29 | +20.37 |
| Level | Major | Major | Major | - | Intermediate | Major | Minor |
Pivot points can also be used to set your price objectives. Here is the price situation in relation to pivot points:
Daily
| Pivot points | S3 | S2 | S1 | PP | R1 | R2 | R3 |
|---|---|---|---|---|---|---|---|
| Standard | 127.09 | 127.75 | 128.85 | 129.51 | 130.61 | 131.27 | 132.37 |
| Camarilla | 129.48 | 129.64 | 129.80 | 129.96 | 130.12 | 130.28 | 130.44 |
| Woodie | 127.32 | 127.86 | 129.08 | 129.62 | 130.84 | 131.38 | 132.60 |
| Fibonacci | 127.75 | 128.42 | 128.83 | 129.51 | 130.18 | 130.59 | 131.27 |
Weekly
| Pivot points | S3 | S2 | S1 | PP | R1 | R2 | R3 |
|---|---|---|---|---|---|---|---|
| Standard | 111.08 | 117.01 | 121.48 | 127.41 | 131.88 | 137.81 | 142.28 |
| Camarilla | 123.09 | 124.04 | 125.00 | 125.95 | 126.90 | 127.86 | 128.81 |
| Woodie | 110.35 | 116.65 | 120.75 | 127.05 | 131.15 | 137.45 | 141.55 |
| Fibonacci | 117.01 | 120.98 | 123.44 | 127.41 | 131.38 | 133.84 | 137.81 |
Monthly
| Pivot points | S3 | S2 | S1 | PP | R1 | R2 | R3 |
|---|---|---|---|---|---|---|---|
| Standard | 93.17 | 97.47 | 103.73 | 108.03 | 114.29 | 118.59 | 124.85 |
| Camarilla | 107.10 | 108.06 | 109.03 | 110.00 | 110.97 | 111.94 | 112.90 |
| Woodie | 94.16 | 97.96 | 104.72 | 108.52 | 115.28 | 119.08 | 125.84 |
| Fibonacci | 97.47 | 101.50 | 103.99 | 108.03 | 112.06 | 114.55 | 118.59 |
Numerical data
The following is the status of the technical indicators and moving averages at the time of publication of this technical analysis:
Technical indicators
Moving averages
| RSI (14): | 58.29 | |
| MACD (12,26,9): | 0.7400 | |
| Directional Movement: | -0.49 | |
| AROON (14): | 78.57 | |
| DEMA (21): | 129.50 | |
| Parabolic SAR (0,02-0,02-0,2): | 127.01 | |
| Elder Ray (13): | 0.76 | |
| Super Trend (3,10): | 130.89 | |
| Zig ZAG (10): | 130.05 | |
| VORTEX (21): | 1.1500 | |
| Stochastique (14,3,5): | 87.87 | |
| TEMA (21): | 129.72 | |
| Williams %R (14): | -8.26 | |
| Chande Momentum Oscillator (20): | 3.79 | |
| Repulse (5,40,3): | 0.6800 | |
| ROCnROLL: | 1 | |
| TRIX (15,9): | 0.0500 | |
| Courbe Coppock: | 4.05 |
| MA7: | 127.34 | |
| MA20: | 120.87 | |
| MA50: | 115.14 | |
| MA100: | 122.19 | |
| MAexp7: | 129.53 | |
| MAexp20: | 128.57 | |
| MAexp50: | 127.02 | |
| MAexp100: | 123.74 | |
| Price / MA7: | +2.91% | |
| Price / MA20: | +8.42% | |
| Price / MA50: | +13.82% | |
| Price / MA100: | +7.25% | |
| Price / MAexp7: | +1.17% | |
| Price / MAexp20: | +1.93% | |
| Price / MAexp50: | +3.17% | |
| Price / MAexp100: | +5.91% |
Quotes :
-
15 min delayed data
-
Actions NASDAQ
News
The last news published on TERADYNE INC. at the time of the generation of this analysis was as follows:
- Teradyne Robotics Welcomes James Davidson as Chief AI Officer
- Teradyne Marks 8,000th J750 Semiconductor Test System Shipment
- Teradyne Declares Quarterly Cash Dividend
- Teradyne Reports First Quarter 2024 Results
- Teradyne Honored as a 2024 VETS Indexes Recognized Employer