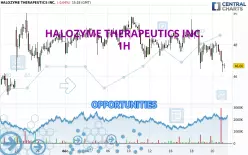
Londinia Opportunities Analyses - 12/23/2024 (GMT) HALOZYME THERAPEUTICS INC. - 1H
0.630
USD
(+1.61%)
03/18/2025 - 15:01
Open
15 min delayed data - NASDAQ Stocks
| Type: | Stocks |
| Ticker: | HALO |
| ISIN: |
- U.S. Stocks
- Timeframe : 1H
- - Analysis generated on 12/23/2024 - 15:35
- Status : INVALID
Summary of the analysis
Trends
Short term:
Strongly bearish
Underlying:
Strongly bearish
Technical indicators
11%
72%
17%
My opinion
Bearish under 47.41 USD
My targets
45.74 USD (-1.99%)
44.03 USD (-5.66%)
My analysis
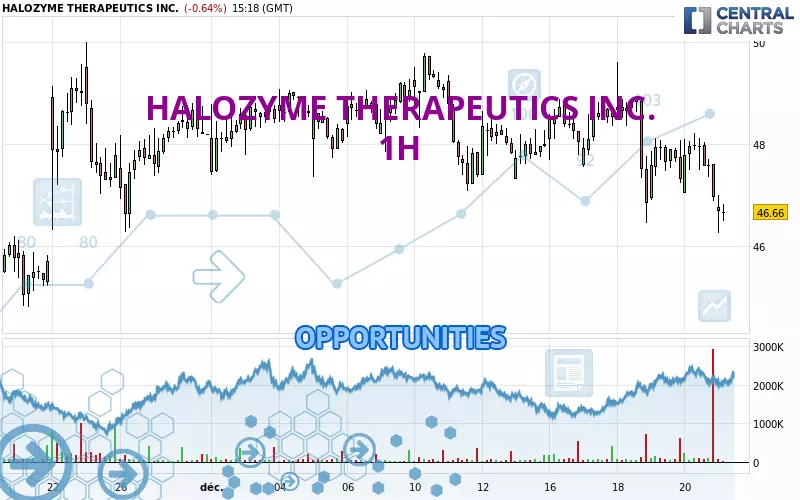
The bearish trend is currently very strong for HALOZYME THERAPEUTICS INC.. As long as the price remains below the resistance at 47.41 USD, you could try to take advantage of the bearish rally. The first bearish objective is located at 45.74 USD. The bearish momentum would be revived by a break in this support. Sellers would then use the next support located at 44.03 USD as an objective. Crossing it would then enable sellers to target 42.01 USD. Be careful, given the powerful bearish rally underway, excesses could lead to a short-term rebound. If this is the case, remember that trading against the trend may be riskier. It would seem more appropriate to wait for a signal indicating reversal of the trend.
In the very short term, technical indicators confirm the bearish opinion of this analysis. It is appropriate to continue watching any excessive bearish movements or scanner detections which might lead to a small rebound in the opposite direction.
Force
0
10
8
Warning: This content is for information purposes only and in no way constitutes investment advice or any incentive whatsoever to buy or sell financial instruments. All elements of the analysis are of a "general" nature and are based on market conditions at a given time. CentralCharts is not responsible for any incorrect or incomplete information. Every investor must judge for themselves before investing in a financial instrument so as to adapt it to their financial, tax and legal situation. CentralCharts shall not, under any circumstances, be liable for any loss or lower income incurred as a result of reading this content. Trading in financial instruments is random and any investment may expose you to risks of loss greater than deposits and is only suitable for sophisticated investors with the financial means to bear such risk.
Additional analysis
Quotes
The HALOZYME THERAPEUTICS INC. rating is 46.67 USD. On the day, this instrument lost -0.62% and was between 46.26 USD and 46.99 USD. This implies that the price is at +0.89% from its lowest and at -0.68% from its highest.46.26
46.99
46.67
The Central Gaps scanner detects the formation of a bearish gap marking the strong presence of sellers ahead of buyers at the opening. This formed a quotation gap.
Opening Gap DOWN
Type : Bearish
Timeframe : Openning
Here is a more detailed summary of the historical variations registered by HALOZYME THERAPEUTICS INC.:
Near a new HIGH record (1 month)
Type : Bullish
Timeframe : Weekly
Technical
Technical analysis of this 1H chart of HALOZYME THERAPEUTICS INC. indicates that the overall trend is strongly bearish. 92.86% of the signals given by moving averages are bearish. The overall trend is supported by the strong bearish signals from short-term moving averages. There is no crossing of moving average by the price or crossing of moving averages between themselves.
In fact, according to the parameters integrated into the Central Analyzer system, 13 technical indicators out of 18 analysed are currently bearish. Caution: the Central Indicators scanner currently detects an excess:
CCI indicator is oversold : under -100
Type : Neutral
Timeframe : 1 hour
The Central Patterns scanner, which studies chart patterns, resistances and supports, has identified this signal:
Support of channel is broken
Type : Bearish
Timeframe : 1 hour
The Central Candlesticks scanner, specialised in Japanese candlesticks, did not identify any signals.
ProTrendLines
S3
S2
S1
R1
R2
R3
Price
| S3 | S2 | S1 | Price | R1 | R2 | R3 | |
|---|---|---|---|---|---|---|---|
| ProTrendLines | 38.51 | 42.01 | 44.03 | 46.67 | 47.41 | 49.14 | 51.52 |
| Change (%) | -17.48% | -9.99% | -5.66% | - | +1.59% | +5.29% | +10.39% |
| Change | -8.16 | -4.66 | -2.64 | - | +0.74 | +2.47 | +4.85 |
| Level | Intermediate | Major | Major | - | Major | Major | Intermediate |
Attention could also be paid to pivot points to set price objectives:
Daily
| Pivot points | S3 | S2 | S1 | PP | R1 | R2 | R3 |
|---|---|---|---|---|---|---|---|
| Standard | 45.16 | 46.02 | 46.49 | 47.35 | 47.82 | 48.68 | 49.15 |
| Camarilla | 46.59 | 46.72 | 46.84 | 46.96 | 47.08 | 47.20 | 47.33 |
| Woodie | 44.97 | 45.92 | 46.30 | 47.25 | 47.63 | 48.58 | 48.96 |
| Fibonacci | 46.02 | 46.53 | 46.84 | 47.35 | 47.86 | 48.17 | 48.68 |
Weekly
| Pivot points | S3 | S2 | S1 | PP | R1 | R2 | R3 |
|---|---|---|---|---|---|---|---|
| Standard | 42.59 | 44.52 | 45.74 | 47.67 | 48.89 | 50.82 | 52.04 |
| Camarilla | 46.09 | 46.38 | 46.67 | 46.96 | 47.25 | 47.54 | 47.83 |
| Woodie | 42.24 | 44.34 | 45.39 | 47.49 | 48.54 | 50.64 | 51.69 |
| Fibonacci | 44.52 | 45.72 | 46.47 | 47.67 | 48.87 | 49.62 | 50.82 |
Monthly
| Pivot points | S3 | S2 | S1 | PP | R1 | R2 | R3 |
|---|---|---|---|---|---|---|---|
| Standard | 19.31 | 30.66 | 39.43 | 50.78 | 59.55 | 70.90 | 79.67 |
| Camarilla | 42.67 | 44.51 | 46.36 | 48.20 | 50.04 | 51.89 | 53.73 |
| Woodie | 18.02 | 30.02 | 38.14 | 50.14 | 58.26 | 70.26 | 78.38 |
| Fibonacci | 30.66 | 38.35 | 43.09 | 50.78 | 58.47 | 63.21 | 70.90 |
Numerical data
The following are the details of the technical indicators and moving averages that were collected to generate this technical analysis:
Technical indicators
Moving averages
| RSI (14): | 33.92 | |
| MACD (12,26,9): | -0.3200 | |
| Directional Movement: | -26.56 | |
| AROON (14): | -35.72 | |
| DEMA (21): | 47.24 | |
| Parabolic SAR (0,02-0,02-0,2): | 48.02 | |
| Elder Ray (13): | -0.73 | |
| Super Trend (3,10): | 48.42 | |
| Zig ZAG (10): | 46.72 | |
| VORTEX (21): | 0.8500 | |
| Stochastique (14,3,5): | 16.62 | |
| TEMA (21): | 47.03 | |
| Williams %R (14): | -76.41 | |
| Chande Momentum Oscillator (20): | -0.92 | |
| Repulse (5,40,3): | -0.8000 | |
| ROCnROLL: | 2 | |
| TRIX (15,9): | -0.0600 | |
| Courbe Coppock: | 2.61 |
| MA7: | 47.49 | |
| MA20: | 48.01 | |
| MA50: | 50.87 | |
| MA100: | 54.70 | |
| MAexp7: | 47.17 | |
| MAexp20: | 47.59 | |
| MAexp50: | 47.94 | |
| MAexp100: | 48.38 | |
| Price / MA7: | -1.73% | |
| Price / MA20: | -2.79% | |
| Price / MA50: | -8.26% | |
| Price / MA100: | -14.68% | |
| Price / MAexp7: | -1.06% | |
| Price / MAexp20: | -1.93% | |
| Price / MAexp50: | -2.65% | |
| Price / MAexp100: | -3.53% |
Quotes :
12/23/2024 - 15:11
-
15 min delayed data
-
Actions NASDAQ
News
The last news published on HALOZYME THERAPEUTICS INC. at the time of the generation of this analysis was as follows:
- 11/27/2024 - 13:30 Halozyme to Present at Upcoming Investor Conferences
- 11/22/2024 - 13:35 Halozyme Withdraws Proposal to Acquire Evotec Following Evotec's Unwillingness to Engage in Discussions
- 11/14/2024 - 21:15 Halozyme Confirms Proposal to Combine with Evotec for €11.00 Per Share in an All-Cash Transaction
- 10/31/2024 - 20:01 HALOZYME REPORTS THIRD QUARTER 2024 FINANCIAL AND OPERATING RESULTS
- 10/24/2024 - 10:30 HALOZYME PROVIDES UPDATE ON LICENSEE CO-FORMULATION PATENT HEARING IN EUROPE