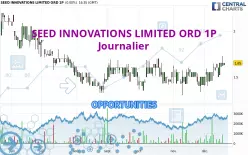
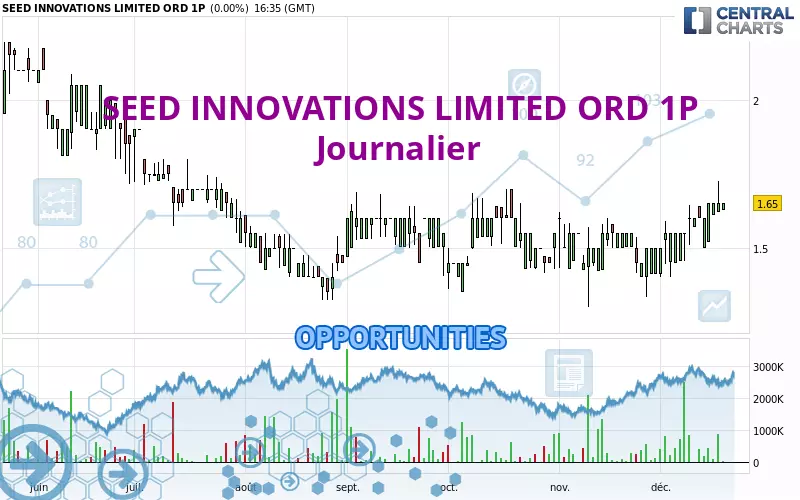
Londinia Opportunities Analyses - 12/20/2024 (GMT) SEED INNOVATIONS LIMITED ORD 1P - Daily
-
GBX
(-)
-
15 min delayed data - London Stock Exchange
| Type: | Stocks |
| Ticker: | SEED |
| ISIN: | GG00BRK9BQ81 |
- Europe Stocks
- Timeframe : Daily
- - Analysis generated on
- Status : INVALID
Summary of the analysis
Trends
Short term:
Strongly bullish
Underlying:
Strongly bullish
Technical indicators
78%
0%
22%
My opinion
Bullish above 1.600 GBX
My targets
1.700 GBX (+3.03%)
1.900 GBX (+15.15%)
My analysis
All elements being clearly bullish, it would be possible for traders to trade only long positions (at the time of purchase) on SEED INNOVATIONS LIMITED ORD 1P as long as the price remains well above 1.600 GBX. The buyers' bullish objective is set at 1.700 GBX. A bullish break in this resistance would boost the bullish momentum. The buyers could then target the resistance located at 1.900 GBX. If there is any crossing, the next objective would be the resistance located at 2.050 GBX. However, beware of bullish excesses that could lead to a possible short-term correction; but this possible correction would not be tradeable.
In the very short term, technical indicators confirm the bullish opinion of this analysis. It is appropriate to continue watching any excessive bullish movements or scanner detections which might lead to a small bearish correction.
Force
0
10
8.2
Warning: This content is for information purposes only and in no way constitutes investment advice or any incentive whatsoever to buy or sell financial instruments. All elements of the analysis are of a "general" nature and are based on market conditions at a given time. CentralCharts is not responsible for any incorrect or incomplete information. Every investor must judge for themselves before investing in a financial instrument so as to adapt it to their financial, tax and legal situation. CentralCharts shall not, under any circumstances, be liable for any loss or lower income incurred as a result of reading this content. Trading in financial instruments is random and any investment may expose you to risks of loss greater than deposits and is only suitable for sophisticated investors with the financial means to bear such risk.
Additional analysis
Quotes
The SEED INNOVATIONS LIMITED ORD 1P rating is 1.650 GBX. On the day, this instrument gained +0.00% and was between 1.627 GBX and 1.650 GBX. This implies that the price is at +1.41% from its lowest and at 0% from its highest.1.627
1.650
1.650
So that you have an overall view of the price change, here is a table showing the variations over several periods:
Near a new HIGH record (1 month)
Type : Bullish
Timeframe : Weekly
Technical
A technical analysis in Journalier of this SEED INNOVATIONS LIMITED ORD 1P chart shows a strongly bullish trend. 89.29% of the signals given by moving averages are bullish. This strongly bullish trend is supported by the strong bullish signals given by short-term moving averages. The Central Indicators market scanner currently does not detect any result that concerns moving averages.
In fact, according to the parameters integrated into the Central Analyzer system, 14 technical indicators out of 18 analysed are currently bullish. Central Indicators, the detector scanner for these technical indicators recently detected a signal:
Price is back over the pivot point
Type : Bullish
Timeframe : Weekly
Central Patterns, the market scanner focusing on chart patterns, resistances and supports found this result:
Near resistance of channel
Type : Bearish
Timeframe : Daily
The Central Candlesticks scanner which studies Japanese candlesticks did not detect anything.
ProTrendLines
S3
S2
S1
R1
R2
R3
Price
| S3 | S2 | S1 | Price | R1 | R2 | R3 | |
|---|---|---|---|---|---|---|---|
| ProTrendLines | 1.347 | 1.450 | 1.600 | 1.650 | 1.700 | 1.900 | 2.050 |
| Change (%) | -18.36% | -12.12% | -3.03% | - | +3.03% | +15.15% | +24.24% |
| Change | -0.303 | -0.200 | -0.050 | - | +0.050 | +0.250 | +0.400 |
| Level | Minor | Intermediate | Major | - | Minor | Minor | Intermediate |
Pivot points can also be used to set your price objectives. Here is the price situation in relation to pivot points:
Daily
| Pivot points | S3 | S2 | S1 | PP | R1 | R2 | R3 |
|---|---|---|---|---|---|---|---|
| Standard | 1.500 | 1.560 | 1.605 | 1.665 | 1.710 | 1.770 | 1.815 |
| Camarilla | 1.621 | 1.631 | 1.640 | 1.650 | 1.660 | 1.669 | 1.679 |
| Woodie | 1.493 | 1.556 | 1.598 | 1.661 | 1.703 | 1.766 | 1.808 |
| Fibonacci | 1.560 | 1.600 | 1.625 | 1.665 | 1.705 | 1.730 | 1.770 |
Weekly
| Pivot points | S3 | S2 | S1 | PP | R1 | R2 | R3 |
|---|---|---|---|---|---|---|---|
| Standard | 1.298 | 1.377 | 1.488 | 1.567 | 1.678 | 1.757 | 1.868 |
| Camarilla | 1.548 | 1.565 | 1.583 | 1.600 | 1.617 | 1.635 | 1.652 |
| Woodie | 1.315 | 1.385 | 1.505 | 1.575 | 1.695 | 1.765 | 1.885 |
| Fibonacci | 1.377 | 1.449 | 1.494 | 1.567 | 1.639 | 1.684 | 1.757 |
Monthly
| Pivot points | S3 | S2 | S1 | PP | R1 | R2 | R3 |
|---|---|---|---|---|---|---|---|
| Standard | 1.007 | 1.153 | 1.327 | 1.473 | 1.647 | 1.793 | 1.967 |
| Camarilla | 1.412 | 1.441 | 1.471 | 1.500 | 1.529 | 1.559 | 1.588 |
| Woodie | 1.020 | 1.160 | 1.340 | 1.480 | 1.660 | 1.800 | 1.980 |
| Fibonacci | 1.153 | 1.276 | 1.351 | 1.473 | 1.596 | 1.671 | 1.793 |
Numerical data
The following are the details of the technical indicators and moving averages that were collected to generate this technical analysis:
Technical indicators
Moving averages
| RSI (14): | 70.56 | |
| MACD (12,26,9): | 0.0320 | |
| Directional Movement: | 4.912 | |
| AROON (14): | 85.714 | |
| DEMA (21): | 1.619 | |
| Parabolic SAR (0,02-0,02-0,2): | 1.453 | |
| Elder Ray (13): | 0.036 | |
| Super Trend (3,10): | 1.394 | |
| Zig ZAG (10): | 1.650 | |
| VORTEX (21): | 1.0600 | |
| Stochastique (14,3,5): | 84.62 | |
| TEMA (21): | 1.647 | |
| Williams %R (14): | -23.08 | |
| Chande Momentum Oscillator (20): | 0.100 | |
| Repulse (5,40,3): | 8.4050 | |
| ROCnROLL: | 1 | |
| TRIX (15,9): | 0.1760 | |
| Courbe Coppock: | 16.10 |
| MA7: | 1.629 | |
| MA20: | 1.560 | |
| MA50: | 1.550 | |
| MA100: | 1.537 | |
| MAexp7: | 1.628 | |
| MAexp20: | 1.584 | |
| MAexp50: | 1.562 | |
| MAexp100: | 1.573 | |
| Price / MA7: | +1.29% | |
| Price / MA20: | +5.77% | |
| Price / MA50: | +6.45% | |
| Price / MA100: | +7.35% | |
| Price / MAexp7: | +1.35% | |
| Price / MAexp20: | +4.17% | |
| Price / MAexp50: | +5.63% | |
| Price / MAexp100: | +4.90% |
Quotes :
-
15 min delayed data
-
London Stock Exchange
News
The latest news and videos published on SEED INNOVATIONS LIMITED ORD 1P at the time of the analysis were as follows:
- Rl Core Technologies Announces Successful Close of $5 Million Seed Round Funding Led by TQ Ventures
- bananaz Exits Stealth with $5.3M Seed Funding to Bring AI Into the World of Change Management in Design and Manufacturing
- MediSun Energy Raises $8.75M Seed Round with Vynn Capital to Drive MENA Expansion and Advance Osmotic Energy Innovation
- Shipfinex Raises $1.5 Million in Seed Funding, Partners with Gaurav Mehta to Transform Maritime Finance
- Alison.ai Secures $13M in Seed Funding to Expand AI-Driven Creative Solutions