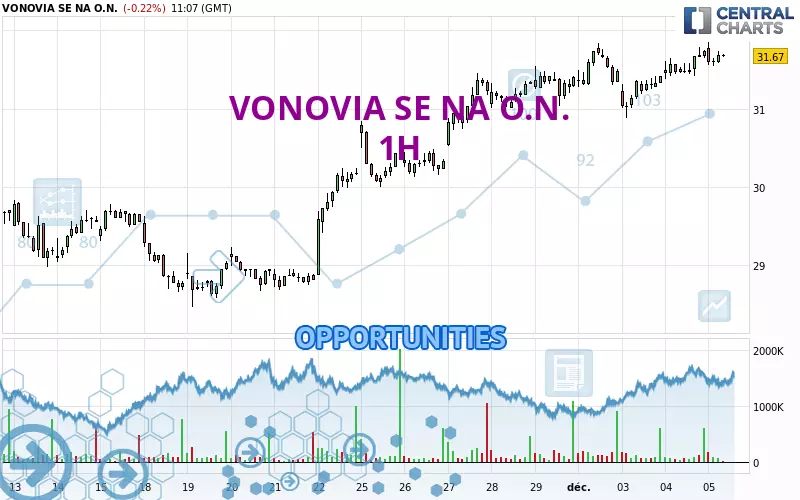
Londinia Opportunities Analyses - 12/05/2024 (GMT) VONOVIA SE NA O.N. - 1H
-
EUR
(-)
-
15 min delayed data - Germany Stocks
| Type: | Stocks |
| Ticker: | VNA |
| ISIN: | DE000A1ML7J1 |
- Europe Stocks
- Timeframe : 1H
- - Analysis generated on
- Status : INVALID
Summary of the analysis
Trends
Short term:
Strongly bullish
Underlying:
Strongly bullish
Technical indicators
83%
0%
17%
My opinion
Bullish above 31.54 EUR
My targets
31.89 EUR (+0.60%)
33.54 EUR (+5.80%)
My analysis
All elements being clearly bullish, it would be possible for traders to trade only long positions (at the time of purchase) on VONOVIA SE NA O.N. as long as the price remains well above 31.54 EUR. The buyers' bullish objective is set at 31.89 EUR. A bullish break in this resistance would boost the bullish momentum. The buyers could then target the resistance located at 33.54 EUR. If there is any crossing, the next objective would be the resistance located at 40.45 EUR. However, beware of bullish excesses that could lead to a possible short-term correction; but this possible correction would not be tradeable.
In the very short term, the general bullish sentiment is confirmed by technical indicators. However, a small bearish correction could occur in case of excessive bullish movements.
Force
0
10
8.8

Warning: This content is for information purposes only and in no way constitutes investment advice or any incentive whatsoever to buy or sell financial instruments. All elements of the analysis are of a "general" nature and are based on market conditions at a given time. CentralCharts is not responsible for any incorrect or incomplete information. Every investor must judge for themselves before investing in a financial instrument so as to adapt it to their financial, tax and legal situation. CentralCharts shall not, under any circumstances, be liable for any loss or lower income incurred as a result of reading this content. Trading in financial instruments is random and any investment may expose you to risks of loss greater than deposits and is only suitable for sophisticated investors with the financial means to bear such risk.
Additional analysis
Quotes
The VONOVIA SE NA O.N. price is 31.70 EUR. The price is lower by -0.13% since the last closing with the lowest point at 31.54 EUR and the highest point at 31.85 EUR. The deviation from the price is +0.51% for the low point and -0.47% for the high point.31.54
31.85
31.70
So that you have an overall view of the price change, here is a table showing the variations over several periods:
New HIGH record (1 month)
Type : Bullish
Timeframe : Weekly
Technical
Technical analysis of VONOVIA SE NA O.N. in 1H shows a strongly overall bullish trend. The signals given by the moving averages are 92.86% bullish. This strong bullish trend is confirmed by the strong signals currently being given by short-term moving averages. The Central Indicators market scanner is currently detecting a bullish signal that could impact this trend:
Moving Average bullish crossovers : AMA20 & AMA50
Type : Bullish
Timeframe : 1 hour
In fact, according to the parameters integrated into the Central Analyzer system, 15 technical indicators out of 18 analysed are currently bullish. Central Indicators, the detector scanner for these technical indicators recently detected a signal:
Price is back over the pivot point
Type : Bullish
Timeframe : 1 hour
An analysis of the price chart with the Central Patterns scanner (detector of chart patterns and resistances and supports) shows a result that can have an impact on the price change:
Near resistance of channel
Type : Bearish
Timeframe : 1 hour
There is also a Japanese candlestick pattern detected by Central Candlesticks that could mark the end of the current short-term trend:
Doji
Type : Neutral
Timeframe : 1 hour
ProTrendLines
S3
S2
S1
R1
R2
R3
Price
| S3 | S2 | S1 | Price | R1 | R2 | R3 | |
|---|---|---|---|---|---|---|---|
| ProTrendLines | 30.17 | 30.87 | 31.54 | 31.70 | 31.89 | 33.54 | 40.45 |
| Change (%) | -4.83% | -2.62% | -0.50% | - | +0.60% | +5.80% | +27.60% |
| Change | -1.53 | -0.83 | -0.16 | - | +0.19 | +1.84 | +8.75 |
| Level | Intermediate | Major | Minor | - | Major | Intermediate | Intermediate |
To determine price objectives, it is also possible to use the pivot points. Here is the price position in relation to pivot points:
Daily
| Pivot points | S3 | S2 | S1 | PP | R1 | R2 | R3 |
|---|---|---|---|---|---|---|---|
| Standard | 31.09 | 31.23 | 31.49 | 31.63 | 31.89 | 32.03 | 32.29 |
| Camarilla | 31.63 | 31.67 | 31.70 | 31.74 | 31.78 | 31.81 | 31.85 |
| Woodie | 31.14 | 31.26 | 31.54 | 31.66 | 31.94 | 32.06 | 32.34 |
| Fibonacci | 31.23 | 31.39 | 31.48 | 31.63 | 31.79 | 31.88 | 32.03 |
Weekly
| Pivot points | S3 | S2 | S1 | PP | R1 | R2 | R3 |
|---|---|---|---|---|---|---|---|
| Standard | 28.88 | 29.44 | 30.42 | 30.98 | 31.96 | 32.52 | 33.50 |
| Camarilla | 30.98 | 31.12 | 31.26 | 31.40 | 31.54 | 31.68 | 31.82 |
| Woodie | 29.09 | 29.55 | 30.63 | 31.09 | 32.17 | 32.63 | 33.71 |
| Fibonacci | 29.44 | 30.03 | 30.39 | 30.98 | 31.57 | 31.93 | 32.52 |
Monthly
| Pivot points | S3 | S2 | S1 | PP | R1 | R2 | R3 |
|---|---|---|---|---|---|---|---|
| Standard | 26.33 | 27.40 | 29.40 | 30.47 | 32.47 | 33.54 | 35.54 |
| Camarilla | 30.56 | 30.84 | 31.12 | 31.40 | 31.68 | 31.96 | 32.24 |
| Woodie | 26.80 | 27.63 | 29.87 | 30.70 | 32.94 | 33.77 | 36.01 |
| Fibonacci | 27.40 | 28.57 | 29.30 | 30.47 | 31.64 | 32.37 | 33.54 |
Numerical data
The following is the status of the technical indicators and moving averages at the time of publication of this technical analysis:
Technical indicators
Moving averages
| RSI (14): | 60.65 | |
| MACD (12,26,9): | 0.1000 | |
| Directional Movement: | 16.19 | |
| AROON (14): | 85.71 | |
| DEMA (21): | 31.65 | |
| Parabolic SAR (0,02-0,02-0,2): | 31.31 | |
| Elder Ray (13): | 0.08 | |
| Super Trend (3,10): | 31.21 | |
| Zig ZAG (10): | 31.69 | |
| VORTEX (21): | 1.0300 | |
| Stochastique (14,3,5): | 63.53 | |
| TEMA (21): | 31.64 | |
| Williams %R (14): | -28.07 | |
| Chande Momentum Oscillator (20): | 0.28 | |
| Repulse (5,40,3): | 0.2400 | |
| ROCnROLL: | 1 | |
| TRIX (15,9): | 0.0400 | |
| Courbe Coppock: | 2.15 |
| MA7: | 31.47 | |
| MA20: | 30.26 | |
| MA50: | 31.01 | |
| MA100: | 30.77 | |
| MAexp7: | 31.62 | |
| MAexp20: | 31.52 | |
| MAexp50: | 31.27 | |
| MAexp100: | 30.85 | |
| Price / MA7: | +0.73% | |
| Price / MA20: | +4.76% | |
| Price / MA50: | +2.23% | |
| Price / MA100: | +3.02% | |
| Price / MAexp7: | +0.25% | |
| Price / MAexp20: | +0.57% | |
| Price / MAexp50: | +1.38% | |
| Price / MAexp100: | +2.76% |
Quotes :
-
15 min delayed data
-
Actions Allemagne
News
Don't forget to follow the news on VONOVIA SE NA O.N.. At the time of publication of this analysis, the latest news was as follows:
- EQS-News: Vonovia resumes growth trajectory, doubling investments to €2 billion
- EQS-News: Three Transactions for Combined Liquidity Generation of € 1.8 billion
- EQS-Adhoc: Vonovia SE: Initiation of the process to conclude a domination and profit and loss transfer agreement between Vonovia SE and Deutsche Wohnen SE
- EQS-News: Vonovia reports robust operating results for the first half of the year and confirms annual guidance at the upper end
- EQS-News: Use it or Lose it: German Economy Minister Robert Habeck visits Berlin pilot for supplementary electric heating to curb wind energy curtailment by Vonovia and decarbon1ze