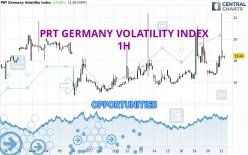
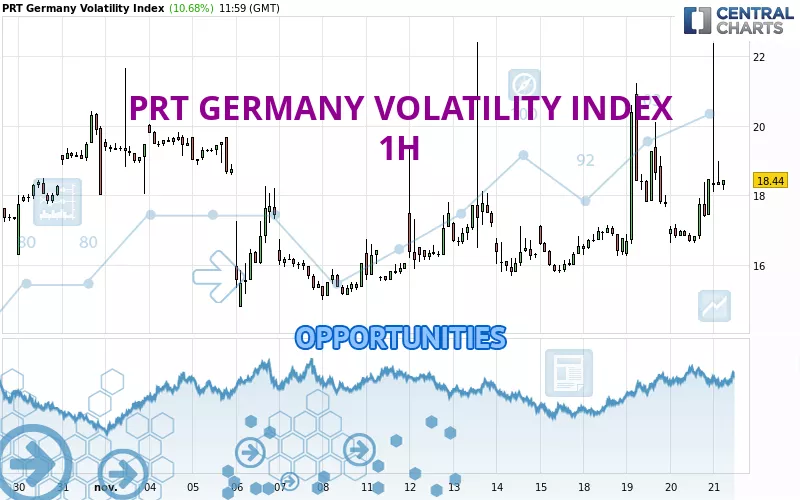
Londinia Opportunities Analyses - 11/21/2024 (GMT) PRT GERMANY VOLATILITY INDEX - 1H
-
EUR
(-)
-
15 min delayed data - EUREX Options
| Type: | Indices |
| Ticker: | PRTDEVI |
| ISIN: |
- FX/Indices
- Timeframe : 1H
- - Analysis generated on
- Status : INVALID
Summary of the analysis
Trends
Short term:
Strongly bullish
Underlying:
Strongly bullish
Technical indicators
67%
28%
6%
My opinion
Bullish above 18.05 EUR
My targets
19.51 EUR (+5.92%)
20.78 EUR (+12.81%)
My analysis
All elements being clearly bullish, it would be possible for traders to trade only long positions (at the time of purchase) on PRT GERMANY VOLATILITY INDEX as long as the price remains well above 18.05 EUR. The buyers' bullish objective is set at 19.51 EUR. A bullish break in this resistance would boost the bullish momentum. The buyers could then target the resistance located at 20.78 EUR. If there is any crossing, the next objective would be the resistance located at 20.94 EUR. However, beware of bullish excesses that could lead to a possible short-term correction; but this possible correction would not be tradeable.
In the very short term, the general bullish sentiment is not called into question, despite technical indicators being indecisive.
Force
0
10
7.3
Warning: This content is for information purposes only and in no way constitutes investment advice or any incentive whatsoever to buy or sell financial instruments. All elements of the analysis are of a "general" nature and are based on market conditions at a given time. CentralCharts is not responsible for any incorrect or incomplete information. Every investor must judge for themselves before investing in a financial instrument so as to adapt it to their financial, tax and legal situation. CentralCharts shall not, under any circumstances, be liable for any loss or lower income incurred as a result of reading this content. Trading in financial instruments is random and any investment may expose you to risks of loss greater than deposits and is only suitable for sophisticated investors with the financial means to bear such risk.
Additional analysis
Quotes
The PRT GERMANY VOLATILITY INDEX rating is 18.42 EUR. On the day, this instrument lost -0.22% with the lowest point at 18.09 EUR and the highest point at 22.37 EUR. The deviation from the price is +1.82% for the low point and -17.66% for the high point.18.09
22.37
18.42
A bearish opening was detected by the Central Gaps scanner. Sellers are trying to impose a bearish trend in the very short term.
Bearish opening
Type : Bearish
Timeframe : Openning
A study of price movements over other periods shows the following variations:
Near a new HIGH record (1 month)
Type : Bullish
Timeframe : Weekly
Technical
Technical analysis of this 1H chart of PRT GERMANY VOLATILITY INDEX indicates that the overall trend is strongly bullish. 92.86% of the signals given by moving averages are bullish. The overall trend is supported by the strong bullish signals from short-term moving averages. The Central Indicators scanner detects a bullish signal on moving averages that could impact this trend:
Bullish trend reversal : Moving Average 100
Type : Bullish
Timeframe : 1 hour
In fact, Central Analyzer took into account 18 technical indicators and the result was as follows: 12 are bullish, 1 are neutral and 5 are bearish. Central Indicators, the scanner specialised in technical indicators, has identified these signals:
Price is back over the pivot point
Type : Bullish
Timeframe : Weekly
Momentum indicator is back over 0
Type : Bullish
Timeframe : 1 hour
The analysis of the price chart with Central Patterns scanners does not return any result.
The presence of a bullish Japanese candlestick pattern detected by Central Candlesticks that could cause a very short term rebound was also detected:
Bullish doji star
Type : Bullish
Timeframe : 1 hour
ProTrendLines
S3
S2
S1
R1
R2
R3
Price
| S3 | S2 | S1 | Price | R1 | R2 | R3 | |
|---|---|---|---|---|---|---|---|
| ProTrendLines | 15.47 | 16.24 | 18.05 | 18.42 | 19.51 | 20.94 | 21.78 |
| Change (%) | -16.02% | -11.83% | -2.01% | - | +5.92% | +13.68% | +18.24% |
| Change | -2.95 | -2.18 | -0.37 | - | +1.09 | +2.52 | +3.36 |
| Level | Intermediate | Minor | Major | - | Major | Intermediate | Major |
Attention could also be paid to pivot points to set price objectives:
Daily
| Pivot points | S3 | S2 | S1 | PP | R1 | R2 | R3 |
|---|---|---|---|---|---|---|---|
| Standard | 15.41 | 16.02 | 17.24 | 17.85 | 19.07 | 19.68 | 20.90 |
| Camarilla | 17.96 | 18.13 | 18.29 | 18.46 | 18.63 | 18.80 | 18.96 |
| Woodie | 15.72 | 16.17 | 17.55 | 18.00 | 19.38 | 19.83 | 21.21 |
| Fibonacci | 16.02 | 16.72 | 17.15 | 17.85 | 18.55 | 18.98 | 19.68 |
Weekly
| Pivot points | S3 | S2 | S1 | PP | R1 | R2 | R3 |
|---|---|---|---|---|---|---|---|
| Standard | 7.08 | 11.31 | 13.93 | 18.16 | 20.78 | 25.01 | 27.63 |
| Camarilla | 14.67 | 15.29 | 15.92 | 16.55 | 17.18 | 17.81 | 18.43 |
| Woodie | 6.28 | 10.91 | 13.13 | 17.76 | 19.98 | 24.61 | 26.83 |
| Fibonacci | 11.31 | 13.93 | 15.54 | 18.16 | 20.78 | 22.39 | 25.01 |
Monthly
| Pivot points | S3 | S2 | S1 | PP | R1 | R2 | R3 |
|---|---|---|---|---|---|---|---|
| Standard | 0.29 | 4.79 | 11.40 | 15.90 | 22.51 | 27.01 | 33.62 |
| Camarilla | 14.95 | 15.96 | 16.98 | 18.00 | 19.02 | 20.04 | 21.06 |
| Woodie | 1.34 | 5.32 | 12.45 | 16.43 | 23.56 | 27.54 | 34.67 |
| Fibonacci | 4.79 | 9.04 | 11.66 | 15.90 | 20.15 | 22.77 | 27.01 |
Numerical data
The following is the status of technical indicators and moving averages registered at the time this technical analysis was created:
Technical indicators
Moving averages
| RSI (14): | 55.73 | |
| MACD (12,26,9): | 0.2600 | |
| Directional Movement: | 39.64 | |
| AROON (14): | 64.28 | |
| DEMA (21): | 17.98 | |
| Parabolic SAR (0,02-0,02-0,2): | 16.86 | |
| Elder Ray (13): | 0.46 | |
| Super Trend (3,10): | 18.80 | |
| Zig ZAG (10): | 18.16 | |
| VORTEX (21): | 1.1000 | |
| Stochastique (14,3,5): | 28.76 | |
| TEMA (21): | 18.03 | |
| Williams %R (14): | -72.86 | |
| Chande Momentum Oscillator (20): | 0.44 | |
| Repulse (5,40,3): | -6.4300 | |
| ROCnROLL: | 1 | |
| TRIX (15,9): | 0.1700 | |
| Courbe Coppock: | 3.03 |
| MA7: | 17.34 | |
| MA20: | 17.49 | |
| MA50: | 16.82 | |
| MA100: | 16.22 | |
| MAexp7: | 18.00 | |
| MAexp20: | 17.65 | |
| MAexp50: | 17.28 | |
| MAexp100: | 17.13 | |
| Price / MA7: | +6.23% | |
| Price / MA20: | +5.32% | |
| Price / MA50: | +9.51% | |
| Price / MA100: | +13.56% | |
| Price / MAexp7: | +2.33% | |
| Price / MAexp20: | +4.36% | |
| Price / MAexp50: | +6.60% | |
| Price / MAexp100: | +7.53% |
Quotes :
-
15 min delayed data
-
Options EUREX