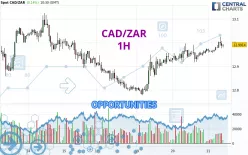
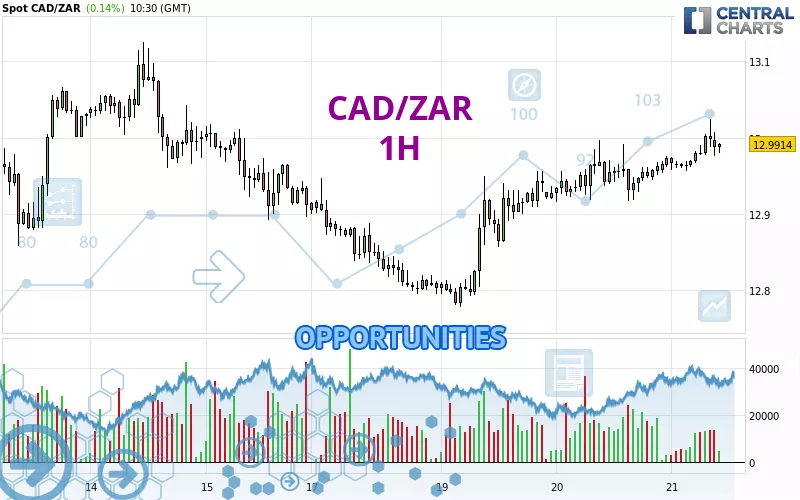
Londinia Opportunities Analyses - 11/21/2024 (GMT) CAD/ZAR - 1H
- FX/Indices
- Timeframe : 1H
- - Analysis generated on
- Status : INVALID
Summary of the analysis
Additional analysis
Quotes
The CAD/ZAR rating is 12.9925 ZAR. The price registered an increase of +0.15% on the session and was between 12.9568 ZAR and 13.0248 ZAR. This implies that the price is at +0.28% from its lowest and at -0.25% from its highest.A bearish opening was detected by the Central Gaps scanner. Sellers are trying to impose a bearish trend in the very short term.
Bearish opening
Type : Bearish
Timeframe : Openning
Here is a more detailed summary of the historical variations registered by CAD/ZAR:
Near a new LOW record (1 year)
Type : Bearish
Timeframe : Weekly
Near a new LOW record (1st january)
Type : Bearish
Timeframe : Weekly
Near a new LOW record (1 month)
Type : Bearish
Timeframe : Weekly
Technical
Technical analysis of CAD/ZAR in 1H shows a strongly overall bullish trend. 92.86% of the signals given by moving averages are bullish. The overall trend is supported by the strong bullish signals from short-term moving averages. An assessment of moving averages reveals a bullish signal that could impact this trend:
Moving Average bullish crossovers : AMA50 & AMA100
Type : Bullish
Timeframe : 1 hour
The probability of a further increase is high given the direction of the technical indicators.
The Central Indicators scanner found no further results concerning independent technical indicators.
An analysis of the price chart with the Central Patterns scanner (detector of chart patterns and resistances and supports) shows several results that can have an impact on the price change:
Near horizontal resistance
Type : Bearish
Timeframe : 1 hour
Resistance of channel is broken
Type : Bullish
Timeframe : 1 hour
The presence of these Japanese chandelier patterns detected by Central Candlesticks that could impact the current short-term trend were also noted:
Bullish harami cross
Type : Bullish
Timeframe : 1 hour
Doji
Type : Neutral
Timeframe : 1 hour
| S3 | S2 | S1 | Price | R1 | R2 | R3 | |
|---|---|---|---|---|---|---|---|
| ProTrendLines | 12.7781 | 12.8583 | 12.9161 | 12.9925 | 12.9959 | 13.0837 | 13.1252 |
| Change (%) | -1.65% | -1.03% | -0.59% | - | +0.03% | +0.70% | +1.02% |
| Change | -0.2144 | -0.1342 | -0.0764 | - | +0.0034 | +0.0912 | +0.1327 |
| Level | Minor | Intermediate | Intermediate | - | Intermediate | Major | Intermediate |
Attention could also be paid to pivot points to set price objectives:
| Pivot points | S3 | S2 | S1 | PP | R1 | R2 | R3 |
|---|---|---|---|---|---|---|---|
| Standard | 12.8447 | 12.8799 | 12.9264 | 12.9616 | 13.0081 | 13.0433 | 13.0898 |
| Camarilla | 12.9503 | 12.9578 | 12.9653 | 12.9728 | 12.9803 | 12.9878 | 12.9953 |
| Woodie | 12.8503 | 12.8827 | 12.9320 | 12.9644 | 13.0137 | 13.0461 | 13.0954 |
| Fibonacci | 12.8799 | 12.9111 | 12.9304 | 12.9616 | 12.9928 | 13.0121 | 13.0433 |
| Pivot points | S3 | S2 | S1 | PP | R1 | R2 | R3 |
|---|---|---|---|---|---|---|---|
| Standard | 12.1420 | 12.3813 | 12.6466 | 12.8859 | 13.1512 | 13.3905 | 13.6558 |
| Camarilla | 12.7731 | 12.8194 | 12.8657 | 12.9119 | 12.9582 | 13.0044 | 13.0507 |
| Woodie | 12.1550 | 12.3878 | 12.6596 | 12.8924 | 13.1642 | 13.3970 | 13.6688 |
| Fibonacci | 12.3813 | 12.5741 | 12.6931 | 12.8859 | 13.0787 | 13.1977 | 13.3905 |
| Pivot points | S3 | S2 | S1 | PP | R1 | R2 | R3 |
|---|---|---|---|---|---|---|---|
| Standard | 12.1329 | 12.3701 | 12.5005 | 12.7377 | 12.8681 | 13.1053 | 13.2357 |
| Camarilla | 12.5299 | 12.5636 | 12.5973 | 12.6310 | 12.6647 | 12.6984 | 12.7321 |
| Woodie | 12.0796 | 12.3434 | 12.4472 | 12.7110 | 12.8148 | 13.0786 | 13.1824 |
| Fibonacci | 12.3701 | 12.5105 | 12.5972 | 12.7377 | 12.8781 | 12.9648 | 13.1053 |
Numerical data
The following is the status of the technical indicators and moving averages at the time of publication of this technical analysis:
| RSI (14): | 61.03 | |
| MACD (12,26,9): | 0.0144 | |
| Directional Movement: | 16.2117 | |
| AROON (14): | 85.7143 | |
| DEMA (21): | 12.9898 | |
| Parabolic SAR (0,02-0,02-0,2): | 12.9417 | |
| Elder Ray (13): | 0.0064 | |
| Super Trend (3,10): | 12.9454 | |
| Zig ZAG (10): | 12.9863 | |
| VORTEX (21): | 1.0767 | |
| Stochastique (14,3,5): | 54.74 | |
| TEMA (21): | 12.9896 | |
| Williams %R (14): | -54.73 | |
| Chande Momentum Oscillator (20): | 0.0184 | |
| Repulse (5,40,3): | -0.0601 | |
| ROCnROLL: | 1 | |
| TRIX (15,9): | 0.0145 | |
| Courbe Coppock: | 0.47 |
| MA7: | 12.9475 | |
| MA20: | 12.7790 | |
| MA50: | 12.8057 | |
| MA100: | 13.0163 | |
| MAexp7: | 12.9848 | |
| MAexp20: | 12.9708 | |
| MAexp50: | 12.9454 | |
| MAexp100: | 12.9233 | |
| Price / MA7: | +0.35% | |
| Price / MA20: | +1.67% | |
| Price / MA50: | +1.46% | |
| Price / MA100: | -0.18% | |
| Price / MAexp7: | +0.06% | |
| Price / MAexp20: | +0.17% | |
| Price / MAexp50: | +0.36% | |
| Price / MAexp100: | +0.54% |