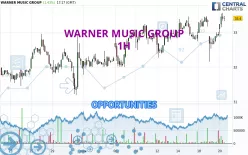
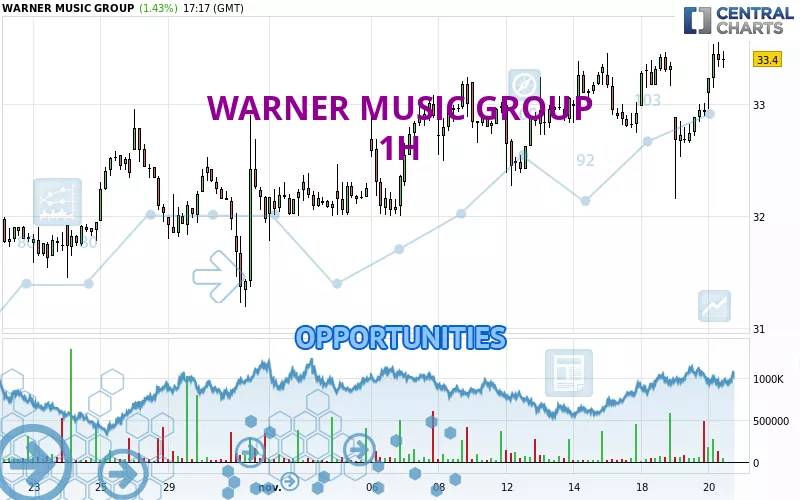
Londinia Opportunities Analyses - 11/20/2024 (GMT) WARNER MUSIC GROUP - 1H
- U.S. Stocks
- Timeframe : 1H
- - Analysis generated on
- Status : INVALID
Summary of the analysis
Trends
Short term:
Strongly bullish
Underlying:
Strongly bullish
Technical indicators
78%
0%
22%
My opinion
Bullish above 33.05 USD
My targets
33.70 USD (+1.02%)
35.02 USD (+4.98%)
My analysis
All elements being clearly bullish, it would be possible for traders to trade only long positions (at the time of purchase) on WARNER MUSIC GROUP as long as the price remains well above 33.05 USD. The buyers' bullish objective is set at 33.70 USD. A bullish break in this resistance would boost the bullish momentum. The buyers could then target the resistance located at 35.02 USD. If there is any crossing, the next objective would be the resistance located at 35.67 USD. However, beware of bullish excesses that could lead to a possible short-term correction; but this possible correction would not be tradeable.
In the very short term, the general bullish sentiment is confirmed by technical indicators. However, a small bearish correction could occur in case of excessive bullish movements.
Force
0
10
8.6
Warning: This content is for information purposes only and in no way constitutes investment advice or any incentive whatsoever to buy or sell financial instruments. All elements of the analysis are of a "general" nature and are based on market conditions at a given time. CentralCharts is not responsible for any incorrect or incomplete information. Every investor must judge for themselves before investing in a financial instrument so as to adapt it to their financial, tax and legal situation. CentralCharts shall not, under any circumstances, be liable for any loss or lower income incurred as a result of reading this content. Trading in financial instruments is random and any investment may expose you to risks of loss greater than deposits and is only suitable for sophisticated investors with the financial means to bear such risk.
Additional analysis
Quotes
WARNER MUSIC GROUP rating 33.36 USD. On the day, this instrument gained +1.31% and was between 32.95 USD and 33.55 USD. This implies that the price is at +1.24% from its lowest and at -0.57% from its highest.32.95
33.55
33.36
So that you have an overall view of the price change, here is a table showing the variations over several periods:
New HIGH record (1 month)
Type : Bullish
Timeframe : Weekly
Technical
A technical analysis in 1H of this WARNER MUSIC GROUP chart shows a strongly bullish trend. 92.86% of the signals given by moving averages are bullish. The overall trend is supported by the strong bullish signals from short-term moving averages. The Central Indicators scanner does not detect any result on moving averages that would impact this trend.
In fact, according to the parameters integrated into the Central Analyzer system, 14 technical indicators out of 18 analysed are currently bullish. Central Indicators, the detector scanner for these technical indicators recently detected a signal:
Pivot points : price is over resistance 1
Type : Neutral
Timeframe : Weekly
The Central Patterns scanner, which studies chart patterns, resistances and supports, has identified this signal:
Resistance of channel is broken
Type : Bullish
Timeframe : 1 hour
The Central Candlesticks scanner currently notes the presence of this pattern in Japanese candlesticks that could mark the end of the short-term trend currently underway:
Doji
Type : Neutral
Timeframe : 1 hour
ProTrendLines
S3
S2
S1
R1
R2
R3
Price
| S3 | S2 | S1 | Price | R1 | R2 | R3 | |
|---|---|---|---|---|---|---|---|
| ProTrendLines | 32.73 | 33.05 | 33.27 | 33.36 | 33.70 | 35.02 | 35.67 |
| Change (%) | -1.89% | -0.93% | -0.27% | - | +1.02% | +4.98% | +6.92% |
| Change | -0.63 | -0.31 | -0.09 | - | +0.34 | +1.66 | +2.31 |
| Level | Intermediate | Minor | Intermediate | - | Minor | Major | Minor |
Attention could also be paid to pivot points to set price objectives:
Daily
| Pivot points | S3 | S2 | S1 | PP | R1 | R2 | R3 |
|---|---|---|---|---|---|---|---|
| Standard | 31.52 | 31.84 | 32.38 | 32.70 | 33.24 | 33.56 | 34.10 |
| Camarilla | 32.69 | 32.77 | 32.85 | 32.93 | 33.01 | 33.09 | 33.17 |
| Woodie | 31.64 | 31.90 | 32.50 | 32.76 | 33.36 | 33.62 | 34.22 |
| Fibonacci | 31.84 | 32.17 | 32.37 | 32.70 | 33.03 | 33.23 | 33.56 |
Weekly
| Pivot points | S3 | S2 | S1 | PP | R1 | R2 | R3 |
|---|---|---|---|---|---|---|---|
| Standard | 30.96 | 31.52 | 32.13 | 32.69 | 33.30 | 33.86 | 34.47 |
| Camarilla | 32.41 | 32.52 | 32.62 | 32.73 | 32.84 | 32.95 | 33.05 |
| Woodie | 30.98 | 31.53 | 32.15 | 32.70 | 33.32 | 33.87 | 34.49 |
| Fibonacci | 31.52 | 31.97 | 32.25 | 32.69 | 33.14 | 33.42 | 33.86 |
Monthly
| Pivot points | S3 | S2 | S1 | PP | R1 | R2 | R3 |
|---|---|---|---|---|---|---|---|
| Standard | 28.16 | 29.26 | 30.52 | 31.62 | 32.88 | 33.98 | 35.24 |
| Camarilla | 31.13 | 31.35 | 31.56 | 31.78 | 32.00 | 32.21 | 32.43 |
| Woodie | 28.24 | 29.30 | 30.60 | 31.66 | 32.96 | 34.02 | 35.32 |
| Fibonacci | 29.26 | 30.16 | 30.72 | 31.62 | 32.52 | 33.08 | 33.98 |
Numerical data
The following are the details of the technical indicators and moving averages that were collected to generate this technical analysis:
Technical indicators
Moving averages
| RSI (14): | 64.97 | |
| MACD (12,26,9): | 0.1100 | |
| Directional Movement: | 12.13 | |
| AROON (14): | 64.29 | |
| DEMA (21): | 33.14 | |
| Parabolic SAR (0,02-0,02-0,2): | 32.23 | |
| Elder Ray (13): | 0.37 | |
| Super Trend (3,10): | 32.69 | |
| Zig ZAG (10): | 33.47 | |
| VORTEX (21): | 1.0900 | |
| Stochastique (14,3,5): | 94.25 | |
| TEMA (21): | 33.19 | |
| Williams %R (14): | -7.14 | |
| Chande Momentum Oscillator (20): | 0.22 | |
| Repulse (5,40,3): | 1.0900 | |
| ROCnROLL: | 1 | |
| TRIX (15,9): | 0.0300 | |
| Courbe Coppock: | 0.98 |
| MA7: | 32.99 | |
| MA20: | 32.44 | |
| MA50: | 31.50 | |
| MA100: | 30.29 | |
| MAexp7: | 33.17 | |
| MAexp20: | 33.01 | |
| MAexp50: | 32.83 | |
| MAexp100: | 32.57 | |
| Price / MA7: | +1.12% | |
| Price / MA20: | +2.84% | |
| Price / MA50: | +5.90% | |
| Price / MA100: | +10.14% | |
| Price / MAexp7: | +0.57% | |
| Price / MAexp20: | +1.06% | |
| Price / MAexp50: | +1.61% | |
| Price / MAexp100: | +2.43% |
Quotes :
-
15 min delayed data
-
Actions NASDAQ
News
The latest news and videos published on WARNER MUSIC GROUP at the time of the analysis were as follows:
- Warner Music Group Corp. Announces Quarterly Cash Dividend
- Warner Music Group Corp. to Conduct Earnings Conference Call on Thursday, November 21, 2024
- Warner Music Group Corp. Announces Quarterly Cash Dividend
- Warner Music Group Corp. Reports Results for Fiscal Third Quarter Ended June 30, 2024
- Warner Music Group Corp. to Conduct Earnings Conference Call on Wednesday, August 7, 2024