Londinia Opportunities Analyses - 11/19/2024 (GMT) AUD/HKD - 1H
- FX/Indices
- Timeframe : 1H
- - Analysis generated on
- Status : INVALID
Summary of the analysis

Additional analysis
Quotes
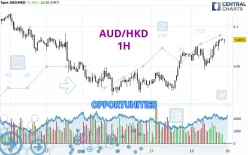
The AUD/HKD price is 5.0833 HKD. The price has increased by +0.38% since the last closing and was traded between 5.0454 HKD and 5.0857 HKD over the period. The price is currently at +0.75% from its lowest and -0.05% from its highest.A study of price movements over other periods shows the following variations:
Near a new LOW record (1 year)
Type : Bearish
Timeframe : Weekly
Near a new LOW record (1st january)
Type : Bearish
Timeframe : Weekly
Near a new HIGH record (1 month)
Type : Bullish
Timeframe : Weekly
Technical
Technical analysis of this 1H chart of AUD/HKD indicates that the overall trend is strongly bullish. The signals given by the moving averages are 92.86% bullish. This strong bullish trend is confirmed by the strong signals currently being given by short-term moving averages. There is no crossing of moving average by the price or crossing of moving averages between themselves.
In fact, 13 technical indicators on 18 studied are currently bullish. But beware of excesses. The Central Indicators scanner currently detects this:
Williams %R indicator is overbought : over -20
Type : Neutral
Timeframe : 1 hour
Pivot points : price is over resistance 1
Type : Neutral
Timeframe : 1 hour
Price is back over the pivot point
Type : Bullish
Timeframe : Weekly
The Central Patterns scanner, which studies chart patterns, resistances and supports, has identified these signals:
Near horizontal resistance
Type : Bearish
Timeframe : 1 hour
Resistance of channel is broken
Type : Bullish
Timeframe : 1 hour
The Central Candlesticks scanner currently notes the presence of this pattern in Japanese candlesticks that could mark the end of the short-term trend currently underway:
Doji
Type : Neutral
Timeframe : 1 hour
| S3 | S2 | S1 | Price | R1 | R2 | R3 | |
|---|---|---|---|---|---|---|---|
| ProTrendLines | 5.0226 | 5.0424 | 5.0738 | 5.0833 | 5.0995 | 5.1299 | 5.1885 |
| Change (%) | -1.19% | -0.80% | -0.19% | - | +0.32% | +0.92% | +2.07% |
| Change | -0.0607 | -0.0409 | -0.0095 | - | +0.0162 | +0.0466 | +0.1052 |
| Level | Major | Intermediate | Major | - | Major | Minor | Major |
To determine price objectives, it is also possible to use the pivot points. Here is the price position in relation to pivot points:
| Pivot points | S3 | S2 | S1 | PP | R1 | R2 | R3 |
|---|---|---|---|---|---|---|---|
| Standard | 4.9831 | 5.0010 | 5.0325 | 5.0504 | 5.0819 | 5.0998 | 5.1313 |
| Camarilla | 5.0503 | 5.0548 | 5.0594 | 5.0639 | 5.0684 | 5.0730 | 5.0775 |
| Woodie | 4.9898 | 5.0044 | 5.0392 | 5.0538 | 5.0886 | 5.1032 | 5.1380 |
| Fibonacci | 5.0010 | 5.0199 | 5.0316 | 5.0504 | 5.0693 | 5.0810 | 5.0998 |
| Pivot points | S3 | S2 | S1 | PP | R1 | R2 | R3 |
|---|---|---|---|---|---|---|---|
| Standard | 4.8693 | 4.9411 | 4.9862 | 5.0580 | 5.1031 | 5.1749 | 5.2200 |
| Camarilla | 4.9991 | 5.0098 | 5.0205 | 5.0312 | 5.0419 | 5.0526 | 5.0634 |
| Woodie | 4.8559 | 4.9344 | 4.9728 | 5.0513 | 5.0897 | 5.1682 | 5.2066 |
| Fibonacci | 4.9411 | 4.9858 | 5.0134 | 5.0580 | 5.1027 | 5.1303 | 5.1749 |
| Pivot points | S3 | S2 | S1 | PP | R1 | R2 | R3 |
|---|---|---|---|---|---|---|---|
| Standard | 4.6876 | 4.8836 | 4.9983 | 5.1943 | 5.3090 | 5.5050 | 5.6197 |
| Camarilla | 5.0276 | 5.0560 | 5.0845 | 5.1130 | 5.1415 | 5.1700 | 5.1984 |
| Woodie | 4.6470 | 4.8633 | 4.9577 | 5.1740 | 5.2684 | 5.4847 | 5.5791 |
| Fibonacci | 4.8836 | 5.0023 | 5.0756 | 5.1943 | 5.3130 | 5.3863 | 5.5050 |
Numerical data
The following is the status of the technical indicators and moving averages at the time of publication of this technical analysis:
| RSI (14): | 64.45 | |
| MACD (12,26,9): | 0.0078 | |
| Directional Movement: | 6.0936 | |
| AROON (14): | 85.7142 | |
| DEMA (21): | 5.0811 | |
| Parabolic SAR (0,02-0,02-0,2): | 5.0661 | |
| Elder Ray (13): | 0.0068 | |
| Super Trend (3,10): | 5.0586 | |
| Zig ZAG (10): | 5.0787 | |
| VORTEX (21): | 1.1134 | |
| Stochastique (14,3,5): | 92.87 | |
| TEMA (21): | 5.0831 | |
| Williams %R (14): | -11.66 | |
| Chande Momentum Oscillator (20): | 0.0243 | |
| Repulse (5,40,3): | 0.0632 | |
| ROCnROLL: | 1 | |
| TRIX (15,9): | 0.0193 | |
| Courbe Coppock: | 0.69 |
| MA7: | 5.0637 | |
| MA20: | 5.1054 | |
| MA50: | 5.2029 | |
| MA100: | 5.2035 | |
| MAexp7: | 5.0796 | |
| MAexp20: | 5.0708 | |
| MAexp50: | 5.0594 | |
| MAexp100: | 5.0581 | |
| Price / MA7: | +0.39% | |
| Price / MA20: | -0.43% | |
| Price / MA50: | -2.30% | |
| Price / MA100: | -2.31% | |
| Price / MAexp7: | +0.07% | |
| Price / MAexp20: | +0.25% | |
| Price / MAexp50: | +0.47% | |
| Price / MAexp100: | +0.50% |