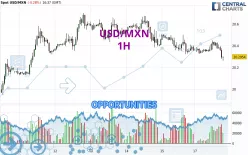
Londinia Opportunities Analyses - 11/18/2024 (GMT) USD/MXN - 1H
- FX/Indices
- Timeframe : 1H
- - Analysis generated on
- Status : LEVEL MAINTAINED
Summary of the analysis

Additional analysis
Quotes
The USD/MXN price is 20.2934 MXN. On the day, this instrument lost -0.29% and was between 20.2593 MXN and 20.4473 MXN. This implies that the price is at +0.17% from its lowest and at -0.75% from its highest.The Central Gaps scanner detects a bullish opening marking the presence of buyers ahead of sellers at the opening but not sufficiently marked to allow the price to register a quotation gap.
Bullish opening
Type : Bullish
Timeframe : Openning
Here is a more detailed summary of the historical variations registered by USD/MXN:
Near a new HIGH record (1 year)
Type : Bullish
Timeframe : Weekly
Near a new HIGH record (1st january)
Type : Bullish
Timeframe : Weekly
Near a new LOW record (1 month)
Type : Bearish
Timeframe : Weekly
Technical
Technical analysis of USD/MXN in 1H shows a overall strongly bearish trend. 92.86% of the signals given by moving averages are bearish. The overall trend is supported by the strong bearish signals from short-term moving averages. There is no crossing of moving average by the price or crossing of moving averages between themselves.
An assessment of technical indicators shows a strong bearish signal.
Caution: the Central Indicators scanner currently detects an excess:
CCI indicator is oversold : under -100
Type : Neutral
Timeframe : 1 hour
Williams %R indicator is oversold : under -80
Type : Neutral
Timeframe : 1 hour
No signals are given by Central Patterns, a market scanner specialised in chart patterns, resistances and supports.
From the Japanese candlestick perspective, the Central Candlesticks scanner notes the presence of these results that could impact the short-term trend:
Bullish harami
Type : Bullish
Timeframe : 1 hour
Three black crows
Type : Bearish
Timeframe : 1 hour
| S3 | S2 | S1 | Price | R1 | R2 | R3 | |
|---|---|---|---|---|---|---|---|
| ProTrendLines | 19.8390 | 20.0023 | 20.1258 | 20.2934 | 20.3543 | 20.5798 | 20.6997 |
| Change (%) | -2.24% | -1.43% | -0.83% | - | +0.30% | +1.41% | +2.00% |
| Change | -0.4544 | -0.2911 | -0.1676 | - | +0.0609 | +0.2864 | +0.4063 |
| Level | Major | Minor | Minor | - | Intermediate | Intermediate | Intermediate |
Attention could also be paid to pivot points to set price objectives:
| Pivot points | S3 | S2 | S1 | PP | R1 | R2 | R3 |
|---|---|---|---|---|---|---|---|
| Standard | 20.0906 | 20.2045 | 20.2787 | 20.3926 | 20.4668 | 20.5807 | 20.6549 |
| Camarilla | 20.3011 | 20.3183 | 20.3356 | 20.3528 | 20.3700 | 20.3873 | 20.4045 |
| Woodie | 20.0707 | 20.1946 | 20.2588 | 20.3827 | 20.4469 | 20.5708 | 20.6350 |
| Fibonacci | 20.2045 | 20.2764 | 20.3208 | 20.3926 | 20.4645 | 20.5089 | 20.5807 |
| Pivot points | S3 | S2 | S1 | PP | R1 | R2 | R3 |
|---|---|---|---|---|---|---|---|
| Standard | 19.5111 | 19.8182 | 20.0855 | 20.3926 | 20.6599 | 20.9670 | 21.2343 |
| Camarilla | 20.1948 | 20.2475 | 20.3002 | 20.3528 | 20.4055 | 20.4581 | 20.5108 |
| Woodie | 19.4912 | 19.8083 | 20.0656 | 20.3827 | 20.6400 | 20.9571 | 21.2144 |
| Fibonacci | 19.8182 | 20.0376 | 20.1732 | 20.3926 | 20.6120 | 20.7476 | 20.9670 |
| Pivot points | S3 | S2 | S1 | PP | R1 | R2 | R3 |
|---|---|---|---|---|---|---|---|
| Standard | 18.2475 | 18.6792 | 19.3663 | 19.7980 | 20.4851 | 20.9168 | 21.6039 |
| Camarilla | 19.7457 | 19.8483 | 19.9508 | 20.0534 | 20.1560 | 20.2585 | 20.3611 |
| Woodie | 18.3752 | 18.7431 | 19.4940 | 19.8619 | 20.6128 | 20.9807 | 21.7316 |
| Fibonacci | 18.6792 | 19.1066 | 19.3706 | 19.7980 | 20.2254 | 20.4894 | 20.9168 |
Numerical data
The following is the status of technical indicators and moving averages registered at the time this technical analysis was created:
| RSI (14): | 33.18 | |
| MACD (12,26,9): | -0.0198 | |
| Directional Movement: | -13.7373 | |
| AROON (14): | -50.0000 | |
| DEMA (21): | 20.3382 | |
| Parabolic SAR (0,02-0,02-0,2): | 20.4439 | |
| Elder Ray (13): | -0.0773 | |
| Super Trend (3,10): | 20.4198 | |
| Zig ZAG (10): | 20.2667 | |
| VORTEX (21): | 0.8876 | |
| Stochastique (14,3,5): | 12.85 | |
| TEMA (21): | 20.3394 | |
| Williams %R (14): | -96.60 | |
| Chande Momentum Oscillator (20): | -0.0819 | |
| Repulse (5,40,3): | -0.5592 | |
| ROCnROLL: | 2 | |
| TRIX (15,9): | -0.0084 | |
| Courbe Coppock: | 0.03 |
| MA7: | 20.3922 | |
| MA20: | 20.1570 | |
| MA50: | 19.7754 | |
| MA100: | 19.2858 | |
| MAexp7: | 20.3368 | |
| MAexp20: | 20.3624 | |
| MAexp50: | 20.3994 | |
| MAexp100: | 20.4111 | |
| Price / MA7: | -0.48% | |
| Price / MA20: | +0.68% | |
| Price / MA50: | +2.62% | |
| Price / MA100: | +5.22% | |
| Price / MAexp7: | -0.21% | |
| Price / MAexp20: | -0.34% | |
| Price / MAexp50: | -0.52% | |
| Price / MAexp100: | -0.58% |
News
The latest news and videos published on USD/MXN at the time of the analysis were as follows:
-
 USD/MXN Forecast November 12, 2024
-
USD/MXN Forecast October 30, 2024
-
USD/MXN Forecast October 25, 2024
-
USD/MXN Forecast September 18, 2024
-
USD/MXN Forecast September 16, 2024