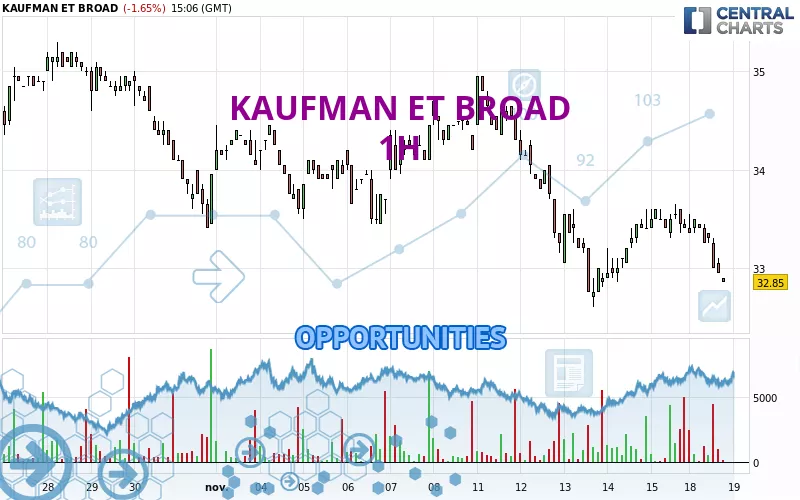
Londinia Opportunities Analyses - 11/18/2024 (GMT) KAUFMAN ET BROAD - 1H
| Type: | Stocks |
| Ticker: | KOF |
| ISIN: | FR0004007813 |
- Europe Stocks
- Timeframe : 1H
- - Analysis generated on
- Status : INVALID
Summary of the analysis

Additional analysis
Quotes
The KAUFMAN ET BROAD rating is 32.90 EUR. The price is lower by -1.50% since the last closing with the lowest point at 32.90 EUR and the highest point at 33.55 EUR. The deviation from the price is 0% for the low point and -1.94% for the high point.Here is a more detailed summary of the historical variations registered by KAUFMAN ET BROAD:
Near a new LOW record (1 month)
Type : Bearish
Timeframe : Weekly
Technical
Technical analysis of KAUFMAN ET BROAD in 1H shows a overall strongly bearish trend. 92.86% of the signals given by moving averages are bearish. The overall trend is supported by the strong bearish signals from short-term moving averages. The Central Indicators market scanner currently does not detect any result that concerns moving averages.
In fact, according to the parameters integrated into the Central Analyzer system, 12 technical indicators out of 18 analysed are currently bearish. Caution: the Central Indicators scanner currently detects an excess:
CCI indicator is oversold : under -100
Type : Neutral
Timeframe : 1 hour
Previous candle closed under Bollinger bands
Type : Neutral
Timeframe : 1 hour
Williams %R indicator is oversold : under -80
Type : Neutral
Timeframe : 1 hour
Pivot points : price is under support 3
Type : Neutral
Timeframe : 1 hour
The Central Patterns scanner, which studies chart patterns, resistances and supports, has identified this signal:
Near horizontal support
Type : Bullish
Timeframe : 1 hour
The Central Candlesticks scanner which studies Japanese candlesticks did not detect anything.
| S3 | S2 | S1 | Price | R1 | R2 | R3 | |
|---|---|---|---|---|---|---|---|
| ProTrendLines | 29.45 | 32.06 | 32.60 | 32.90 | 33.10 | 33.45 | 34.10 |
| Change (%) | -10.49% | -2.55% | -0.91% | - | +0.61% | +1.67% | +3.65% |
| Change | -3.45 | -0.84 | -0.30 | - | +0.20 | +0.55 | +1.20 |
| Level | Minor | Major | Major | - | Major | Minor | Intermediate |
To determine price objectives, it is also possible to use the pivot points. Here is the price position in relation to pivot points:
| Pivot points | S3 | S2 | S1 | PP | R1 | R2 | R3 |
|---|---|---|---|---|---|---|---|
| Standard | 32.90 | 33.10 | 33.25 | 33.45 | 33.60 | 33.80 | 33.95 |
| Camarilla | 33.30 | 33.34 | 33.37 | 33.40 | 33.43 | 33.46 | 33.50 |
| Woodie | 32.88 | 33.09 | 33.23 | 33.44 | 33.58 | 33.79 | 33.93 |
| Fibonacci | 33.10 | 33.23 | 33.32 | 33.45 | 33.58 | 33.67 | 33.80 |
| Pivot points | S3 | S2 | S1 | PP | R1 | R2 | R3 |
|---|---|---|---|---|---|---|---|
| Standard | 30.00 | 31.30 | 32.35 | 33.65 | 34.70 | 36.00 | 37.05 |
| Camarilla | 32.75 | 32.97 | 33.19 | 33.40 | 33.62 | 33.83 | 34.05 |
| Woodie | 29.88 | 31.24 | 32.23 | 33.59 | 34.58 | 35.94 | 36.93 |
| Fibonacci | 31.30 | 32.20 | 32.75 | 33.65 | 34.55 | 35.10 | 36.00 |
| Pivot points | S3 | S2 | S1 | PP | R1 | R2 | R3 |
|---|---|---|---|---|---|---|---|
| Standard | 24.35 | 26.95 | 30.45 | 33.05 | 36.55 | 39.15 | 42.65 |
| Camarilla | 32.27 | 32.83 | 33.39 | 33.95 | 34.51 | 35.07 | 35.63 |
| Woodie | 24.80 | 27.18 | 30.90 | 33.28 | 37.00 | 39.38 | 43.10 |
| Fibonacci | 26.95 | 29.28 | 30.72 | 33.05 | 35.38 | 36.82 | 39.15 |
Numerical data
The following is the status of the technical indicators and moving averages at the time of publication of this technical analysis:
| RSI (14): | 39.17 | |
| MACD (12,26,9): | -0.0800 | |
| Directional Movement: | -16.75 | |
| AROON (14): | -57.15 | |
| DEMA (21): | 33.22 | |
| Parabolic SAR (0,02-0,02-0,2): | 33.61 | |
| Elder Ray (13): | -0.27 | |
| Super Trend (3,10): | 33.53 | |
| Zig ZAG (10): | 33.05 | |
| VORTEX (21): | 1.0300 | |
| Stochastique (14,3,5): | 6.73 | |
| TEMA (21): | 33.25 | |
| Williams %R (14): | -92.31 | |
| Chande Momentum Oscillator (20): | -0.45 | |
| Repulse (5,40,3): | -0.9400 | |
| ROCnROLL: | 2 | |
| TRIX (15,9): | -0.0200 | |
| Courbe Coppock: | 0.82 |
| MA7: | 33.50 | |
| MA20: | 34.03 | |
| MA50: | 33.45 | |
| MA100: | 31.95 | |
| MAexp7: | 33.22 | |
| MAexp20: | 33.32 | |
| MAexp50: | 33.52 | |
| MAexp100: | 33.78 | |
| Price / MA7: | -1.79% | |
| Price / MA20: | -3.32% | |
| Price / MA50: | -1.64% | |
| Price / MA100: | +2.97% | |
| Price / MAexp7: | -0.96% | |
| Price / MAexp20: | -1.26% | |
| Price / MAexp50: | -1.85% | |
| Price / MAexp100: | -2.61% |
News
The last news published on KAUFMAN ET BROAD at the time of the generation of this analysis was as follows:
- Kaufman & Broad SA: RESULTS FOR THE FIRST NINE MONTHS FOR THE YEAR 2024
- Kaufman & Broad SA: FITCH RATINGS CONFIRMS KAUFMAN & BROAD'S INVESTMENT GRADE RATING
- Kaufman & Broad SA: AVAILABILITY OF THE 2024 HALF YEARLY INTERIM FINANCIAL REPORT
- Kaufman & Broad SA: IMPLEMENTATION OF THE SHARE BUY-BACK PROGRAM
- Kaufman & Broad SA: NEW SYNDICATED LOAN AGREEMENT FOR €200M OVER 5 YEARS