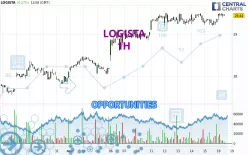
Londinia Opportunities Analyses - 11/18/2024 (GMT) LOGISTA - 1H
| Type: | Stocks |
| Ticker: | LOG |
| ISIN: | ES0105027009 |
- Europe Stocks
- Timeframe : 1H
- - Analysis generated on
- Status : TARGET REACHED
Summary of the analysis
Additional analysis
Quotes
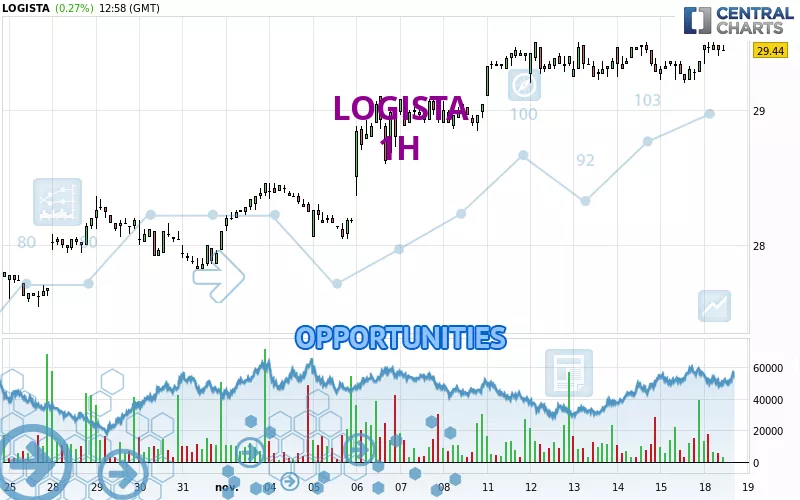
LOGISTA rating 29.44 EUR. The price has increased by +0.27% since the last closing and was traded between 29.34 EUR and 29.50 EUR over the period. The price is currently at +0.34% from its lowest and -0.20% from its highest.The Central Gaps scanner detects the formation of a bullish gap marking the strong presence of buyers against sellers at the opening. This formed a quotation gap.
Opening Gap UP
Type : Bullish
Timeframe : Openning
A study of price movements over other periods shows the following variations:
New HIGH record (5 years)
Type : Bullish
Timeframe : Weekly
New HIGH record (1 year)
Type : Bullish
Timeframe : Weekly
New HIGH record (1st january)
Type : Bullish
Timeframe : Weekly
New HIGH record (1 month)
Type : Bullish
Timeframe : Weekly
Technical
Technical analysis of this 1H chart of LOGISTA indicates that the overall trend is strongly bullish. 92.86% of the signals given by moving averages are bullish. This strongly bullish trend is supported by the strong bullish signals given by short-term moving averages. The Central Indicators market scanner currently does not detect any result that concerns moving averages.
Technical indicators are strongly bullish, suggesting that the price increase should continue.
Caution: the Central Indicators scanner currently detects an excess:
Williams %R indicator is overbought : over -20
Type : Neutral
Timeframe : 1 hour
Pivot points : price is over resistance 1
Type : Neutral
Timeframe : 1 hour
Central Patterns, the market scanner focusing on chart patterns, resistances and supports found these results:
Near horizontal resistance
Type : Bearish
Timeframe : 1 hour
Resistance of channel is broken
Type : Bullish
Timeframe : 1 hour
The Central Candlesticks scanner which studies Japanese candlesticks did not detect anything.
| S3 | S2 | S1 | Price | |
|---|---|---|---|---|
| ProTrendLines | 28.84 | 29.22 | 29.40 | 29.44 |
| Change (%) | -2.04% | -0.75% | -0.14% | - |
| Change | -0.60 | -0.22 | -0.04 | - |
| Level | Minor | Intermediate | Major | - |
Pivot points can also be used to set your price objectives. Here is the price situation in relation to pivot points:
| Pivot points | S3 | S2 | S1 | PP | R1 | R2 | R3 |
|---|---|---|---|---|---|---|---|
| Standard | 29.09 | 29.15 | 29.25 | 29.31 | 29.41 | 29.47 | 29.57 |
| Camarilla | 29.32 | 29.33 | 29.35 | 29.36 | 29.38 | 29.39 | 29.40 |
| Woodie | 29.12 | 29.16 | 29.28 | 29.32 | 29.44 | 29.48 | 29.60 |
| Fibonacci | 29.15 | 29.21 | 29.25 | 29.31 | 29.37 | 29.41 | 29.47 |
| Pivot points | S3 | S2 | S1 | PP | R1 | R2 | R3 |
|---|---|---|---|---|---|---|---|
| Standard | 28.74 | 28.92 | 29.14 | 29.32 | 29.54 | 29.72 | 29.94 |
| Camarilla | 29.25 | 29.29 | 29.32 | 29.36 | 29.40 | 29.43 | 29.47 |
| Woodie | 28.76 | 28.93 | 29.16 | 29.33 | 29.56 | 29.73 | 29.96 |
| Fibonacci | 28.92 | 29.07 | 29.17 | 29.32 | 29.47 | 29.57 | 29.72 |
| Pivot points | S3 | S2 | S1 | PP | R1 | R2 | R3 |
|---|---|---|---|---|---|---|---|
| Standard | 25.12 | 25.82 | 26.96 | 27.66 | 28.80 | 29.50 | 30.64 |
| Camarilla | 27.59 | 27.76 | 27.93 | 28.10 | 28.27 | 28.44 | 28.61 |
| Woodie | 25.34 | 25.93 | 27.18 | 27.77 | 29.02 | 29.61 | 30.86 |
| Fibonacci | 25.82 | 26.52 | 26.96 | 27.66 | 28.36 | 28.80 | 29.50 |
Numerical data
The following is the status of the technical indicators and moving averages at the time of publication of this technical analysis:
| RSI (14): | 57.93 | |
| MACD (12,26,9): | 0.0400 | |
| Directional Movement: | 4.41 | |
| AROON (14): | 35.71 | |
| DEMA (21): | 29.42 | |
| Parabolic SAR (0,02-0,02-0,2): | 29.24 | |
| Elder Ray (13): | 0.05 | |
| Super Trend (3,10): | 29.20 | |
| Zig ZAG (10): | 29.46 | |
| VORTEX (21): | 1.0500 | |
| Stochastique (14,3,5): | 86.67 | |
| TEMA (21): | 29.42 | |
| Williams %R (14): | -13.33 | |
| Chande Momentum Oscillator (20): | 0.14 | |
| Repulse (5,40,3): | 0.2300 | |
| ROCnROLL: | 1 | |
| TRIX (15,9): | 0.0100 | |
| Courbe Coppock: | 0.35 |
| MA7: | 29.33 | |
| MA20: | 28.56 | |
| MA50: | 27.84 | |
| MA100: | 27.32 | |
| MAexp7: | 29.42 | |
| MAexp20: | 29.38 | |
| MAexp50: | 29.27 | |
| MAexp100: | 29.00 | |
| Price / MA7: | +0.38% | |
| Price / MA20: | +3.08% | |
| Price / MA50: | +5.75% | |
| Price / MA100: | +7.76% | |
| Price / MAexp7: | +0.07% | |
| Price / MAexp20: | +0.20% | |
| Price / MAexp50: | +0.58% | |
| Price / MAexp100: | +1.52% |