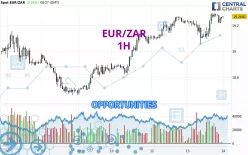
Londinia Opportunities Analyses - 11/14/2024 (GMT) EUR/ZAR - 1H
- FX/Indices
- Timeframe : 1H
- - Analysis generated on
- Status : LEVEL MAINTAINED
Summary of the analysis

Additional analysis
Quotes
EUR/ZAR rating 19.2705 ZAR. The price registered an increase of +0.03% on the session and was between 19.2544 ZAR and 19.2735 ZAR. This implies that the price is at +0.08% from its lowest and at -0.02% from its highest.Here is a more detailed summary of the historical variations registered by EUR/ZAR:
Near a new LOW record (1 year)
Type : Bearish
Timeframe : Weekly
Near a new LOW record (1st january)
Type : Bearish
Timeframe : Weekly
Near a new LOW record (1 month)
Type : Bearish
Timeframe : Weekly
Technical
Technical analysis of this 1H chart of EUR/ZAR indicates that the overall trend is strongly bullish. 92.86% of the signals given by moving averages are bullish. The overall trend is supported by the strong bullish signals from short-term moving averages. The Central Indicators market scanner currently does not detect any result that concerns moving averages.
In fact, according to the parameters integrated into the Central Analyzer system, 13 technical indicators out of 18 analysed are currently bullish. The Central Indicators scanner found this result concerning these indicators:
Pivot points : price is over resistance 1
Type : Neutral
Timeframe : Weekly
Central Patterns, the market scanner focusing on chart patterns, resistances and supports found these results:
Near horizontal support
Type : Bullish
Timeframe : 1 hour
Support of channel is broken
Type : Bearish
Timeframe : 1 hour
For a small setback in the very short term, the Central Candlesticks scanner currently notes the presence of this bearish pattern in Japanese candlesticks:
Dark cloud cover
Type : Bearish
Timeframe : 1 hour
| S3 | S2 | S1 | Price | R1 | R2 | R3 | |
|---|---|---|---|---|---|---|---|
| ProTrendLines | 19.0463 | 19.1410 | 19.2118 | 19.2705 | 19.2723 | 19.5269 | 20.2234 |
| Change (%) | -1.16% | -0.67% | -0.30% | - | +0.01% | +1.33% | +4.94% |
| Change | -0.2242 | -0.1295 | -0.0587 | - | +0.0018 | +0.2564 | +0.9529 |
| Level | Minor | Major | Intermediate | - | Intermediate | Major | Intermediate |
Pivot points can also be used to set your price objectives. Here is the price situation in relation to pivot points:
| Pivot points | S3 | S2 | S1 | PP | R1 | R2 | R3 |
|---|---|---|---|---|---|---|---|
| Standard | 18.8734 | 18.9641 | 19.1140 | 19.2047 | 19.3546 | 19.4453 | 19.5952 |
| Camarilla | 19.1977 | 19.2198 | 19.2419 | 19.2639 | 19.2860 | 19.3080 | 19.3301 |
| Woodie | 18.9030 | 18.9789 | 19.1436 | 19.2195 | 19.3842 | 19.4601 | 19.6248 |
| Fibonacci | 18.9641 | 19.0560 | 19.1128 | 19.2047 | 19.2966 | 19.3534 | 19.4453 |
| Pivot points | S3 | S2 | S1 | PP | R1 | R2 | R3 |
|---|---|---|---|---|---|---|---|
| Standard | 18.1220 | 18.3915 | 18.6185 | 18.8880 | 19.1150 | 19.3845 | 19.6115 |
| Camarilla | 18.7089 | 18.7544 | 18.7999 | 18.8454 | 18.8909 | 18.9364 | 18.9819 |
| Woodie | 18.1007 | 18.3809 | 18.5972 | 18.8774 | 19.0937 | 19.3739 | 19.5902 |
| Fibonacci | 18.3915 | 18.5812 | 18.6984 | 18.8880 | 19.0777 | 19.1949 | 19.3845 |
| Pivot points | S3 | S2 | S1 | PP | R1 | R2 | R3 |
|---|---|---|---|---|---|---|---|
| Standard | 18.4458 | 18.6718 | 18.9152 | 19.1412 | 19.3846 | 19.6106 | 19.8540 |
| Camarilla | 19.0295 | 19.0725 | 19.1156 | 19.1586 | 19.2016 | 19.2447 | 19.2877 |
| Woodie | 18.4545 | 18.6762 | 18.9239 | 19.1456 | 19.3933 | 19.6150 | 19.8627 |
| Fibonacci | 18.6718 | 18.8511 | 18.9619 | 19.1412 | 19.3205 | 19.4313 | 19.6106 |
Numerical data
The following is the status of technical indicators and moving averages registered at the time this technical analysis was created:
| RSI (14): | 59.73 | |
| MACD (12,26,9): | 0.0245 | |
| Directional Movement: | 1.7542 | |
| AROON (14): | 35.7143 | |
| DEMA (21): | 19.2558 | |
| Parabolic SAR (0,02-0,02-0,2): | 19.1731 | |
| Elder Ray (13): | 0.0208 | |
| Super Trend (3,10): | 19.1314 | |
| Zig ZAG (10): | 19.2715 | |
| VORTEX (21): | 1.0520 | |
| Stochastique (14,3,5): | 83.45 | |
| TEMA (21): | 19.2590 | |
| Williams %R (14): | -17.18 | |
| Chande Momentum Oscillator (20): | 0.1289 | |
| Repulse (5,40,3): | 0.0909 | |
| ROCnROLL: | 1 | |
| TRIX (15,9): | 0.0118 | |
| Courbe Coppock: | 1.18 |
| MA7: | 19.0526 | |
| MA20: | 19.0781 | |
| MA50: | 19.2490 | |
| MA100: | 19.5373 | |
| MAexp7: | 19.2561 | |
| MAexp20: | 19.2267 | |
| MAexp50: | 19.1752 | |
| MAexp100: | 19.1056 | |
| Price / MA7: | +1.14% | |
| Price / MA20: | +1.01% | |
| Price / MA50: | +0.11% | |
| Price / MA100: | -1.37% | |
| Price / MAexp7: | +0.07% | |
| Price / MAexp20: | +0.23% | |
| Price / MAexp50: | +0.50% | |
| Price / MAexp100: | +0.86% |
News
Don't forget to follow the news on EUR/ZAR. At the time of publication of this analysis, the latest news was as follows: