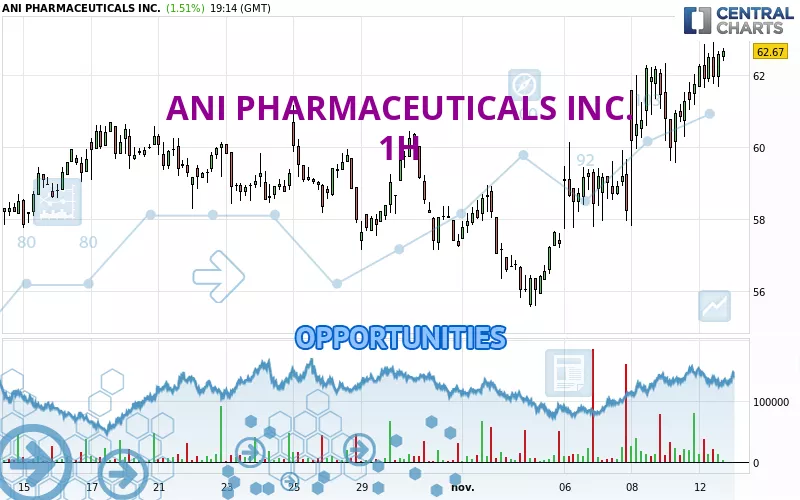
Londinia Opportunities Analyses - 11/12/2024 (GMT) ANI PHARMACEUTICALS INC. - 1H
- U.S. Stocks
- Timeframe : 1H
- - Analysis generated on 11/12/2024 - 19:30
- Status : INVALID
Summary of the analysis
Trends
Short term:
Strongly bullish
Underlying:
Strongly bullish
Technical indicators
61%
0%
39%
My opinion
Bullish above 62.31 USD
My targets
63.75 USD (+1.72%)
65.71 USD (+4.85%)
My analysis
ANI PHARMACEUTICALS INC. is part of a very strong bullish trend. Traders may consider trading only long positions (at the time of purchase) as long as the price remains well above 62.31 USD. The next resistance located at 63.75 USD is the next bullish objective to be reached. A bullish break in this resistance would boost the bullish momentum. The bullish movement could then continue towards the next resistance located at 65.71 USD. After this resistance, buyers could then target 70.61 USD. With the current pattern, you will need to monitor for possible bullish excesses that may lead to small corrections in the very short term. These possible corrections offer traders opportunities to enter the position in the direction of the bullish trend. Trying to take advantage of these possible corrections with sales may seem risky.
In the very short term, the general bullish sentiment is confirmed by technical indicators. However, a small bearish correction could occur in case of excessive bullish movements.
Force
0
10
8

Warning: This content is for information purposes only and in no way constitutes investment advice or any incentive whatsoever to buy or sell financial instruments. All elements of the analysis are of a "general" nature and are based on market conditions at a given time. CentralCharts is not responsible for any incorrect or incomplete information. Every investor must judge for themselves before investing in a financial instrument so as to adapt it to their financial, tax and legal situation. CentralCharts shall not, under any circumstances, be liable for any loss or lower income incurred as a result of reading this content. Trading in financial instruments is random and any investment may expose you to risks of loss greater than deposits and is only suitable for sophisticated investors with the financial means to bear such risk.
Additional analysis
Quotes
ANI PHARMACEUTICALS INC. rating 62.67 USD. The price registered an increase of +1.51% on the session and was between 61.63 USD and 62.91 USD. This implies that the price is at +1.69% from its lowest and at -0.38% from its highest.61.63
62.91
62.67
So that you have an overall view of the price change, here is a table showing the variations over several periods:
New HIGH record (1 month)
Type : Bullish
Timeframe : Weekly
Technical
Technical analysis of this 1H chart of ANI PHARMACEUTICALS INC. indicates that the overall trend is strongly bullish. 92.86% of the signals given by moving averages are bullish. This strongly bullish trend is supported by the strong bullish signals given by short-term moving averages. The Central Indicators scanner does not detect any result on moving averages that would impact this trend.
In fact, 11 technical indicators on 18 studied are currently bullish. No additional result has been identified by Central Indicators, the scanner specialised in technical indicators.
An analysis of the price chart with the Central Patterns scanner (detector of chart patterns and resistances and supports) shows several results that can have an impact on the price change:
Near horizontal resistance
Type : Bearish
Timeframe : 1 hour
Resistance of channel is broken
Type : Bullish
Timeframe : 1 hour
The Central Candlesticks scanner which studies Japanese candlesticks did not detect anything.
ProTrendLines
S3
S2
S1
R1
R2
R3
Price
| S3 | S2 | S1 | Price | R1 | R2 | R3 | |
|---|---|---|---|---|---|---|---|
| ProTrendLines | 58.53 | 60.34 | 62.31 | 62.67 | 63.75 | 65.71 | 70.61 |
| Change (%) | -6.61% | -3.72% | -0.57% | - | +1.72% | +4.85% | +12.67% |
| Change | -4.14 | -2.33 | -0.36 | - | +1.08 | +3.04 | +7.94 |
| Level | Intermediate | Major | Intermediate | - | Minor | Intermediate | Major |
Attention could also be paid to pivot points to set price objectives:
Daily
| Pivot points | S3 | S2 | S1 | PP | R1 | R2 | R3 |
|---|---|---|---|---|---|---|---|
| Standard | 57.32 | 58.44 | 60.09 | 61.21 | 62.86 | 63.98 | 65.63 |
| Camarilla | 60.98 | 61.23 | 61.49 | 61.74 | 61.99 | 62.25 | 62.50 |
| Woodie | 57.59 | 58.57 | 60.36 | 61.34 | 63.13 | 64.11 | 65.90 |
| Fibonacci | 58.44 | 59.50 | 60.15 | 61.21 | 62.27 | 62.92 | 63.98 |
Weekly
| Pivot points | S3 | S2 | S1 | PP | R1 | R2 | R3 |
|---|---|---|---|---|---|---|---|
| Standard | 50.52 | 53.03 | 57.24 | 59.75 | 63.96 | 66.47 | 70.68 |
| Camarilla | 59.59 | 60.21 | 60.82 | 61.44 | 62.06 | 62.67 | 63.29 |
| Woodie | 51.36 | 53.46 | 58.08 | 60.18 | 64.80 | 66.90 | 71.52 |
| Fibonacci | 53.03 | 55.60 | 57.19 | 59.75 | 62.32 | 63.91 | 66.47 |
Monthly
| Pivot points | S3 | S2 | S1 | PP | R1 | R2 | R3 |
|---|---|---|---|---|---|---|---|
| Standard | 48.18 | 51.55 | 54.40 | 57.77 | 60.62 | 63.99 | 66.84 |
| Camarilla | 55.53 | 56.10 | 56.67 | 57.24 | 57.81 | 58.38 | 58.95 |
| Woodie | 47.91 | 51.42 | 54.13 | 57.64 | 60.35 | 63.86 | 66.57 |
| Fibonacci | 51.55 | 53.93 | 55.40 | 57.77 | 60.15 | 61.62 | 63.99 |
Numerical data
The following is the status of technical indicators and moving averages registered at the time this technical analysis was created:
Technical indicators
Moving averages
| RSI (14): | 60.44 | |
| MACD (12,26,9): | 0.8000 | |
| Directional Movement: | 9.21 | |
| AROON (14): | 57.15 | |
| DEMA (21): | 62.22 | |
| Parabolic SAR (0,02-0,02-0,2): | 61.07 | |
| Elder Ray (13): | 0.35 | |
| Super Trend (3,10): | 59.00 | |
| Zig ZAG (10): | 62.17 | |
| VORTEX (21): | 1.1100 | |
| Stochastique (14,3,5): | 79.18 | |
| TEMA (21): | 62.44 | |
| Williams %R (14): | -17.55 | |
| Chande Momentum Oscillator (20): | 0.88 | |
| Repulse (5,40,3): | 0.7000 | |
| ROCnROLL: | 1 | |
| TRIX (15,9): | 0.2000 | |
| Courbe Coppock: | 3.54 |
| MA7: | 59.37 | |
| MA20: | 59.12 | |
| MA50: | 58.60 | |
| MA100: | 60.36 | |
| MAexp7: | 61.95 | |
| MAexp20: | 61.14 | |
| MAexp50: | 59.97 | |
| MAexp100: | 59.34 | |
| Price / MA7: | +5.56% | |
| Price / MA20: | +6.00% | |
| Price / MA50: | +6.95% | |
| Price / MA100: | +3.83% | |
| Price / MAexp7: | +1.16% | |
| Price / MAexp20: | +2.50% | |
| Price / MAexp50: | +4.50% | |
| Price / MAexp100: | +5.61% |
Quotes :
11/12/2024 - 19:07
-
15 min delayed data
-
Actions NASDAQ
News
The latest news and videos published on ANI PHARMACEUTICALS INC. at the time of the analysis were as follows:
- 05/20/2024 - 15:00 SHAREHOLDER ALERT: Purcell & Lefkowitz LLP Announces Shareholder Investigation of ANI Pharmaceuticals, Inc. (NASDAQ: ANIP)
- 05/22/2023 - 20:05 ANI Pharmaceuticals to Present at the Jefferies Healthcare Conference
- 05/16/2023 - 20:05 ANI Pharmaceuticals Announces Closing of Public Offering of Common Stock Including Full Exercise of Underwriters’ Option to Purchase Additional Shares
- 05/15/2023 - 10:50 ANI Pharmaceuticals Announces FDA Approval and Commercialization of Two ANDAs with CGT Exclusivity
- 05/12/2023 - 11:03 ANI Pharmaceuticals Announces Pricing of $75 Million Public Offering of Common Stock