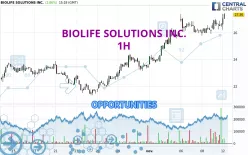
Londinia Opportunities Analyses - 11/12/2024 (GMT) BIOLIFE SOLUTIONS INC. - 1H
- U.S. Stocks
- Timeframe : 1H
- - Analysis generated on
- Status : INVALID
Summary of the analysis
Additional analysis
Quotes
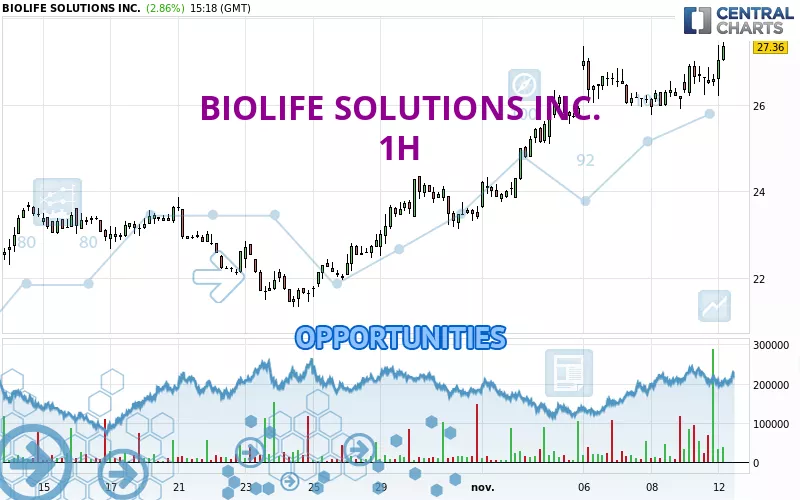
The BIOLIFE SOLUTIONS INC. rating is 27.34 USD. On the day, this instrument gained +2.78% and was between 26.20 USD and 27.40 USD. This implies that the price is at +4.35% from its lowest and at -0.22% from its highest.So that you have an overall view of the price change, here is a table showing the variations over several periods:
Near a new HIGH record (1 year)
Type : Bullish
Timeframe : Weekly
Near a new HIGH record (1st january)
Type : Bullish
Timeframe : Weekly
Near a new HIGH record (1 month)
Type : Bullish
Timeframe : Weekly
Technical
A technical analysis in 1H of this BIOLIFE SOLUTIONS INC. chart shows a strongly bullish trend. 92.86% of the signals given by moving averages are bullish. The overall trend is supported by the strong bullish signals from short-term moving averages. An assessment of moving averages reveals a bullish signal that could impact this trend:
Moving Average bullish crossovers : AMA20 & AMA50
Type : Bullish
Timeframe : 1 hour
In fact, 14 technical indicators on 18 studied are currently positioned bullish. Central Indicators, the detector scanner for these technical indicators has recently detected several signals:
Pivot points : price is over resistance 1
Type : Neutral
Timeframe : 1 hour
Parabolic SAR indicator bearish reversal
Type : Bearish
Timeframe : 1 hour
An analysis of the price chart with the Central Patterns scanner (detector of chart patterns and resistances and supports) shows a result that can have an impact on the price change:
Resistance of channel is broken
Type : Bullish
Timeframe : 1 hour
The Central Candlesticks scanner which studies Japanese candlesticks did not detect anything.
| S3 | S2 | S1 | Price | R1 | R2 | R3 | |
|---|---|---|---|---|---|---|---|
| ProTrendLines | 23.86 | 25.54 | 26.51 | 27.34 | 27.36 | 37.86 | 45.75 |
| Change (%) | -12.73% | -6.58% | -3.04% | - | +0.07% | +38.48% | +67.34% |
| Change | -3.48 | -1.80 | -0.83 | - | +0.02 | +10.52 | +18.41 |
| Level | Intermediate | Major | Intermediate | - | Intermediate | Minor | Intermediate |
Pivot points can also be used to set your price objectives. Here is the price situation in relation to pivot points:
| Pivot points | S3 | S2 | S1 | PP | R1 | R2 | R3 |
|---|---|---|---|---|---|---|---|
| Standard | 25.38 | 25.79 | 26.19 | 26.60 | 27.00 | 27.41 | 27.81 |
| Camarilla | 26.38 | 26.45 | 26.53 | 26.60 | 26.67 | 26.75 | 26.82 |
| Woodie | 25.39 | 25.79 | 26.20 | 26.60 | 27.01 | 27.41 | 27.82 |
| Fibonacci | 25.79 | 26.10 | 26.29 | 26.60 | 26.91 | 27.10 | 27.41 |
| Pivot points | S3 | S2 | S1 | PP | R1 | R2 | R3 |
|---|---|---|---|---|---|---|---|
| Standard | 20.69 | 22.27 | 24.20 | 25.78 | 27.71 | 29.29 | 31.22 |
| Camarilla | 25.17 | 25.49 | 25.81 | 26.13 | 26.45 | 26.77 | 27.10 |
| Woodie | 20.87 | 22.36 | 24.38 | 25.87 | 27.89 | 29.38 | 31.40 |
| Fibonacci | 22.27 | 23.61 | 24.44 | 25.78 | 27.12 | 27.95 | 29.29 |
| Pivot points | S3 | S2 | S1 | PP | R1 | R2 | R3 |
|---|---|---|---|---|---|---|---|
| Standard | 17.76 | 19.54 | 21.47 | 23.25 | 25.18 | 26.96 | 28.89 |
| Camarilla | 22.38 | 22.72 | 23.06 | 23.40 | 23.74 | 24.08 | 24.42 |
| Woodie | 17.84 | 19.58 | 21.55 | 23.29 | 25.26 | 27.00 | 28.97 |
| Fibonacci | 19.54 | 20.96 | 21.83 | 23.25 | 24.67 | 25.54 | 26.96 |
Numerical data
The following are the details of the technical indicators and moving averages that were collected to generate this technical analysis:
| RSI (14): | 66.97 | |
| MACD (12,26,9): | 0.2700 | |
| Directional Movement: | 16.26 | |
| AROON (14): | 100.00 | |
| DEMA (21): | 26.84 | |
| Parabolic SAR (0,02-0,02-0,2): | 27.00 | |
| Elder Ray (13): | 0.19 | |
| Super Trend (3,10): | 25.64 | |
| Zig ZAG (10): | 27.29 | |
| VORTEX (21): | 0.9400 | |
| Stochastique (14,3,5): | 70.57 | |
| TEMA (21): | 26.71 | |
| Williams %R (14): | -12.51 | |
| Chande Momentum Oscillator (20): | 1.21 | |
| Repulse (5,40,3): | 3.0700 | |
| ROCnROLL: | 1 | |
| TRIX (15,9): | 0.1300 | |
| Courbe Coppock: | 4.15 |
| MA7: | 26.30 | |
| MA20: | 24.15 | |
| MA50: | 24.14 | |
| MA100: | 23.61 | |
| MAexp7: | 26.70 | |
| MAexp20: | 26.45 | |
| MAexp50: | 25.78 | |
| MAexp100: | 24.96 | |
| Price / MA7: | +3.95% | |
| Price / MA20: | +13.21% | |
| Price / MA50: | +13.26% | |
| Price / MA100: | +15.80% | |
| Price / MAexp7: | +2.40% | |
| Price / MAexp20: | +3.36% | |
| Price / MAexp50: | +6.05% | |
| Price / MAexp100: | +9.54% |
News
The latest news and videos published on BIOLIFE SOLUTIONS INC. at the time of the analysis were as follows:
- BioLife Solutions Announces $73 Million Sale of its SciSafe Biostorage Subsidiary
- BioLife Solutions to Report Third Quarter 2024 Financial Results and Business Update on November 12, 2024
- BioLife Solutions Reports Second Quarter 2024 Financial Results
- BioLife Solutions to Report Second Quarter 2024 Financial Results and Business Update on August 8, 2024
- BioLife Solutions Introduces the CellSeal CryoCase™ at International Society for Cell & Gene Therapies (ISCT) Conference in Vancouver