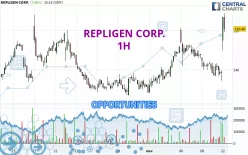
Londinia Opportunities Analyses - 11/12/2024 (GMT) REPLIGEN CORP. - 1H
- U.S. Stocks
- Timeframe : 1H
- - Analysis generated on
- Status : INVALID
Summary of the analysis
Additional analysis
Quotes
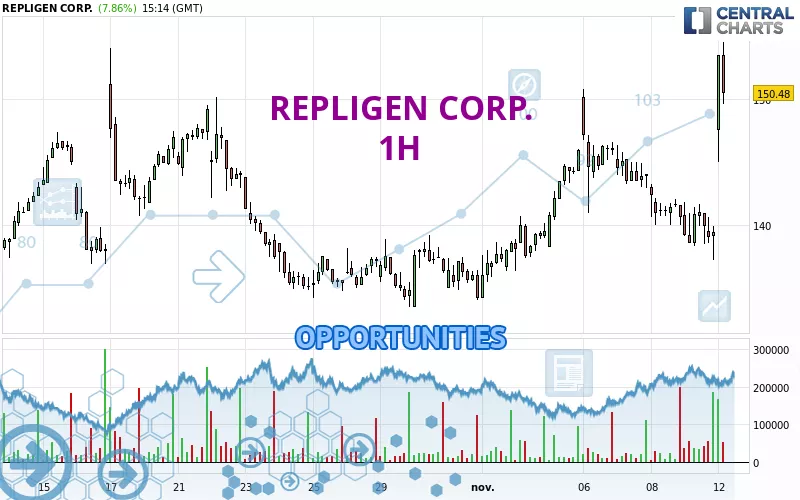
REPLIGEN CORP. rating 150.71 USD. The price registered an increase of +8.03% on the session with the lowest point at 145.00 USD and the highest point at 154.48 USD. The deviation from the price is +3.94% for the low point and -2.44% for the high point.So that you have an overall view of the price change, here is a table showing the variations over several periods:
Near a new LOW record (1 month)
Type : Bearish
Timeframe : Weekly
Technical
A technical analysis in 1H of this REPLIGEN CORP. chart shows a strongly bullish trend. 92.86% of the signals given by moving averages are bullish. This strongly bullish trend is supported by the strong bullish signals given by short-term moving averages. An assessment of moving averages reveals several bullish signals that could impact this trend:
Bullish trend reversal : Moving Average 20
Type : Bullish
Timeframe : 1 hour
Bullish trend reversal : Moving Average 100
Type : Bullish
Timeframe : 1 hour
Bullish trend reversal : adaptative moving average 20
Type : Bullish
Timeframe : 1 hour
Bullish trend reversal : adaptative moving average 50
Type : Bullish
Timeframe : 1 hour
Bullish trend reversal : adaptative moving average 100
Type : Bullish
Timeframe : 1 hour
In fact, 14 technical indicators on 18 studied are currently bullish. Central Indicators, the detector scanner for these technical indicators has recently detected several signals:
Pivot points : price is over resistance 1
Type : Neutral
Timeframe : Weekly
Pivot points : price is over resistance 3
Type : Neutral
Timeframe : 1 hour
The Central Patterns scanner, which studies chart patterns, resistances and supports, has identified this signal:
Horizontal resistance is broken
Type : Bullish
Timeframe : 1 hour
The Central Candlesticks scanner, specialised in Japanese candlesticks, did not identify any signals.
| S3 | S2 | S1 | Price | R1 | R2 | R3 | |
|---|---|---|---|---|---|---|---|
| ProTrendLines | 139.93 | 147.37 | 149.08 | 150.71 | 150.78 | 153.99 | 166.88 |
| Change (%) | -7.15% | -2.22% | -1.08% | - | +0.05% | +2.18% | +10.73% |
| Change | -10.78 | -3.34 | -1.63 | - | +0.07 | +3.28 | +16.17 |
| Level | Major | Minor | Intermediate | - | Intermediate | Intermediate | Major |
Pivot points can also be used to set your price objectives. Here is the price situation in relation to pivot points:
| Pivot points | S3 | S2 | S1 | PP | R1 | R2 | R3 |
|---|---|---|---|---|---|---|---|
| Standard | 132.68 | 134.98 | 137.24 | 139.54 | 141.80 | 144.10 | 146.36 |
| Camarilla | 138.26 | 138.67 | 139.09 | 139.51 | 139.93 | 140.35 | 140.76 |
| Woodie | 132.67 | 134.97 | 137.23 | 139.53 | 141.79 | 144.09 | 146.35 |
| Fibonacci | 134.98 | 136.72 | 137.80 | 139.54 | 141.28 | 142.36 | 144.10 |
| Pivot points | S3 | S2 | S1 | PP | R1 | R2 | R3 |
|---|---|---|---|---|---|---|---|
| Standard | 120.09 | 128.24 | 134.47 | 142.62 | 148.85 | 157.00 | 163.23 |
| Camarilla | 136.74 | 138.05 | 139.37 | 140.69 | 142.01 | 143.33 | 144.65 |
| Woodie | 119.12 | 127.76 | 133.50 | 142.14 | 147.88 | 156.52 | 162.26 |
| Fibonacci | 128.24 | 133.74 | 137.13 | 142.62 | 148.12 | 151.51 | 157.00 |
| Pivot points | S3 | S2 | S1 | PP | R1 | R2 | R3 |
|---|---|---|---|---|---|---|---|
| Standard | 106.43 | 119.88 | 127.08 | 140.53 | 147.73 | 161.18 | 168.38 |
| Camarilla | 128.59 | 130.48 | 132.38 | 134.27 | 136.16 | 138.06 | 139.95 |
| Woodie | 103.30 | 118.32 | 123.95 | 138.97 | 144.60 | 159.62 | 165.25 |
| Fibonacci | 119.88 | 127.77 | 132.65 | 140.53 | 148.42 | 153.30 | 161.18 |
Numerical data
The following is the status of technical indicators and moving averages registered at the time this technical analysis was created:
| RSI (14): | 69.03 | |
| MACD (12,26,9): | 1.0000 | |
| Directional Movement: | 19.85 | |
| AROON (14): | 14.29 | |
| DEMA (21): | 142.18 | |
| Parabolic SAR (0,02-0,02-0,2): | 137.27 | |
| Elder Ray (13): | 9.01 | |
| Super Trend (3,10): | 142.47 | |
| Zig ZAG (10): | 151.15 | |
| VORTEX (21): | 1.0000 | |
| Stochastique (14,3,5): | 72.15 | |
| TEMA (21): | 144.54 | |
| Williams %R (14): | -21.50 | |
| Chande Momentum Oscillator (20): | 9.59 | |
| Repulse (5,40,3): | 1.6800 | |
| ROCnROLL: | 1 | |
| TRIX (15,9): | -0.0200 | |
| Courbe Coppock: | 2.03 |
| MA7: | 143.75 | |
| MA20: | 140.86 | |
| MA50: | 141.53 | |
| MA100: | 141.55 | |
| MAexp7: | 145.21 | |
| MAexp20: | 142.21 | |
| MAexp50: | 141.57 | |
| MAexp100: | 141.15 | |
| Price / MA7: | +4.84% | |
| Price / MA20: | +6.99% | |
| Price / MA50: | +6.49% | |
| Price / MA100: | +6.47% | |
| Price / MAexp7: | +3.79% | |
| Price / MAexp20: | +5.98% | |
| Price / MAexp50: | +6.46% | |
| Price / MAexp100: | +6.77% |
News
The last news published on REPLIGEN CORP. at the time of the generation of this analysis was as follows:
- Thinking about trading options or stock in Repligen, Zendesk, United Airlines, Dollar Tree, or BioNTech?
- 908 Devices Appoints Tony J. Hunt, President and CEO, Repligen, to its Board of Directors
- EC Mergers & Acquisitions advised ARTeSYN on its Sale to Repligen
- Repligen Corporation to Host Earnings Call
- Repligen Corporation to Host Earnings Call