Londinia Opportunities Analyses - 11/04/2024 (GMT) MFE A - 1H
0.665
EUR
(-3.62%)
03/28/2025 - 16:03
Closed
15 min delayed data - Italy Stocks
| Type: | Stocks |
| Ticker: | MFEA |
| ISIN: | NL0015001OI1 |
- Europe Stocks
- Timeframe : 1H
- - Analysis generated on 11/04/2024 - 09:23
- Status : INVALID
Summary of the analysis
Trends
Short term:
Strongly bearish
Underlying:
Strongly bearish
Technical indicators
6%
78%
17%
My opinion
Bearish under 2.959 EUR
My targets
2.922 EUR (-0.75%)
2.784 EUR (-5.43%)
My analysis
All elements being clearly bearish, it would be possible for traders to trade only short positions (for sale) on MFE A as long as the price remains well below 2.959 EUR. The sellers' bearish objective is set at 2.922 EUR. A bearish break of this support would revive the bearish momentum. The sellers could then target the support located at 2.784 EUR. In case of crossing, the next objective would be the support located at 2.374 EUR. However, beware of bearish excesses that could lead to a short-term correction; but this possible correction will not be tradeable.
In the very short term, the general bearish sentiment is confirmed by technical indicators. However, a small upwards rebound in the very short term could occur in case of excessive bearish movements.
Force
0
10
8.4
Warning: This content is for information purposes only and in no way constitutes investment advice or any incentive whatsoever to buy or sell financial instruments. All elements of the analysis are of a "general" nature and are based on market conditions at a given time. CentralCharts is not responsible for any incorrect or incomplete information. Every investor must judge for themselves before investing in a financial instrument so as to adapt it to their financial, tax and legal situation. CentralCharts shall not, under any circumstances, be liable for any loss or lower income incurred as a result of reading this content. Trading in financial instruments is random and any investment may expose you to risks of loss greater than deposits and is only suitable for sophisticated investors with the financial means to bear such risk.
Additional analysis
Quotes
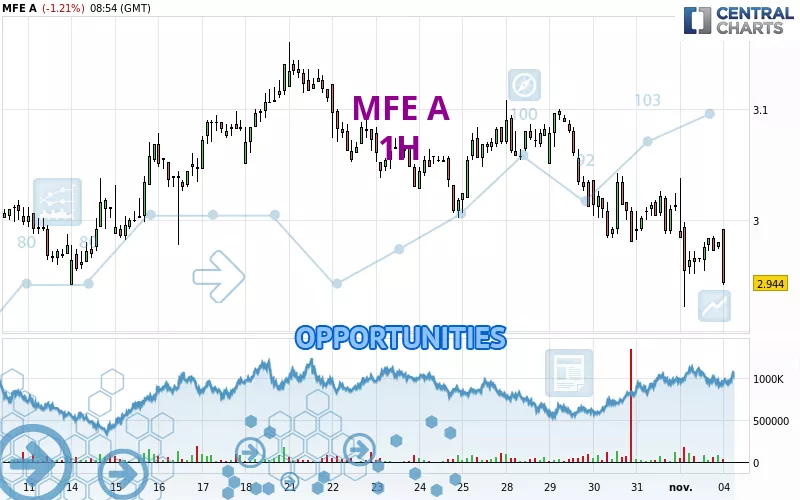
The MFE A price is 2.944 EUR. On the day, this instrument lost -1.21% with the lowest point at 2.942 EUR and the highest point at 2.992 EUR. The deviation from the price is +0.07% for the low point and -1.60% for the high point.2.942
2.992
2.944
The Central Gaps scanner detects a bullish opening marking the presence of buyers ahead of sellers at the opening but not sufficiently marked to allow the price to register a quotation gap.
Bullish opening
Type : Bullish
Timeframe : Openning
Here is a more detailed summary of the historical variations registered by MFE A:
Near a new LOW record (1 month)
Type : Bearish
Timeframe : Weekly
Technical
Technical analysis of this 1H chart of MFE A indicates that the overall trend is strongly bearish. 92.86% of the signals given by moving averages are bearish. This strongly bearish trend is supported by the strong bearish signals given by short-term moving averages. The Central Indicators market scanner currently does not detect any result that concerns moving averages.
In fact, 14 technical indicators on 18 studied are currently positioned bearish. Caution: the Central Indicators scanner currently detects an excess:
CCI indicator is oversold : under -100
Type : Neutral
Timeframe : 1 hour
MACD crosses DOWN its Moving Average
Type : Bearish
Timeframe : 1 hour
Price is back under the pivot point
Type : Bearish
Timeframe : 1 hour
No signals are given by Central Patterns, a market scanner specialised in chart patterns, resistances and supports.
The presence of a bearish pattern in Japanese candlesticks detected by Central Candlesticks that could cause a correction in the very short term was also detected:
Bearish engulfing lines
Type : Bearish
Timeframe : 1 hour
ProTrendLines
S3
S2
S1
R1
R2
R3
Price
| S3 | S2 | S1 | Price | R1 | R2 | R3 | |
|---|---|---|---|---|---|---|---|
| ProTrendLines | 2.374 | 2.784 | 2.922 | 2.944 | 2.959 | 2.979 | 3.002 |
| Change (%) | -19.36% | -5.43% | -0.75% | - | +0.51% | +1.19% | +1.97% |
| Change | -0.570 | -0.160 | -0.022 | - | +0.015 | +0.035 | +0.058 |
| Level | Major | Intermediate | Minor | - | Major | Intermediate | Intermediate |
Pivot points can also be used to set your price objectives. Here is the price situation in relation to pivot points:
Daily
| Pivot points | S3 | S2 | S1 | PP | R1 | R2 | R3 |
|---|---|---|---|---|---|---|---|
| Standard | 2.806 | 2.864 | 2.922 | 2.980 | 3.038 | 3.096 | 3.154 |
| Camarilla | 2.948 | 2.959 | 2.969 | 2.980 | 2.991 | 3.001 | 3.012 |
| Woodie | 2.806 | 2.864 | 2.922 | 2.980 | 3.038 | 3.096 | 3.154 |
| Fibonacci | 2.864 | 2.908 | 2.936 | 2.980 | 3.024 | 3.052 | 3.096 |
Weekly
| Pivot points | S3 | S2 | S1 | PP | R1 | R2 | R3 |
|---|---|---|---|---|---|---|---|
| Standard | 2.713 | 2.817 | 2.899 | 3.003 | 3.085 | 3.189 | 3.271 |
| Camarilla | 2.929 | 2.946 | 2.963 | 2.980 | 2.997 | 3.014 | 3.031 |
| Woodie | 2.701 | 2.812 | 2.887 | 2.998 | 3.073 | 3.184 | 3.259 |
| Fibonacci | 2.817 | 2.888 | 2.932 | 3.003 | 3.074 | 3.118 | 3.189 |
Monthly
| Pivot points | S3 | S2 | S1 | PP | R1 | R2 | R3 |
|---|---|---|---|---|---|---|---|
| Standard | 2.638 | 2.790 | 2.902 | 3.054 | 3.166 | 3.318 | 3.430 |
| Camarilla | 2.941 | 2.966 | 2.990 | 3.014 | 3.038 | 3.062 | 3.087 |
| Woodie | 2.618 | 2.780 | 2.882 | 3.044 | 3.146 | 3.308 | 3.410 |
| Fibonacci | 2.790 | 2.891 | 2.953 | 3.054 | 3.155 | 3.217 | 3.318 |
Numerical data
The following is the status of the technical indicators and moving averages at the time of publication of this technical analysis:
Technical indicators
Moving averages
| RSI (14): | 40.44 | |
| MACD (12,26,9): | -0.0160 | |
| Directional Movement: | -17.571 | |
| AROON (14): | -7.143 | |
| DEMA (21): | 2.963 | |
| Parabolic SAR (0,02-0,02-0,2): | 3.023 | |
| Elder Ray (13): | -0.010 | |
| Super Trend (3,10): | 3.041 | |
| Zig ZAG (10): | 2.956 | |
| VORTEX (21): | 0.8750 | |
| Stochastique (14,3,5): | 37.36 | |
| TEMA (21): | 2.959 | |
| Williams %R (14): | -81.03 | |
| Chande Momentum Oscillator (20): | -0.046 | |
| Repulse (5,40,3): | -2.0500 | |
| ROCnROLL: | 2 | |
| TRIX (15,9): | -0.0800 | |
| Courbe Coppock: | 2.29 |
| MA7: | 3.012 | |
| MA20: | 3.035 | |
| MA50: | 2.990 | |
| MA100: | 3.001 | |
| MAexp7: | 2.969 | |
| MAexp20: | 2.987 | |
| MAexp50: | 3.013 | |
| MAexp100: | 3.032 | |
| Price / MA7: | -2.26% | |
| Price / MA20: | -3.00% | |
| Price / MA50: | -1.54% | |
| Price / MA100: | -1.90% | |
| Price / MAexp7: | -0.84% | |
| Price / MAexp20: | -1.44% | |
| Price / MAexp50: | -2.29% | |
| Price / MAexp100: | -2.90% |
Quotes :
11/04/2024 - 08:54
-
15 min delayed data
-
Actions Italie