Londinia Opportunities Analyses - 11/01/2024 (GMT) GENOWAY - Daily
| Type: | Stocks |
| Ticker: | ALGEN |
| ISIN: | FR0004053510 |
- Europe Stocks
- Timeframe : Daily
- - Analysis generated on
- Status : INVALID
Summary of the analysis

Additional analysis
Quotes
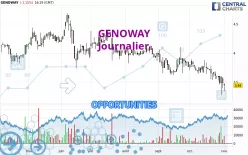
GENOWAY rating 3.44 EUR. The price is lower by -1.15% since the last closing and was traded between 3.34 EUR and 3.47 EUR over the period. The price is currently at +2.99% from its lowest and -0.86% from its highest.A bearish opening was detected by the Central Gaps scanner. Sellers are trying to impose a bearish trend in the very short term.
Bearish opening
Type : Bearish
Timeframe : Openning
Here is a more detailed summary of the historical variations registered by GENOWAY:
Near a new LOW record (1 year)
Type : Bearish
Timeframe : Weekly
Near a new LOW record (1st january)
Type : Bearish
Timeframe : Weekly
Near a new LOW record (1 month)
Type : Bearish
Timeframe : Weekly
Technical
Technical analysis of this Journalier chart of GENOWAY indicates that the overall trend is strongly bearish. The signals given by moving averages are 92.86% bearish. This strong bearish trend is confirmed by the strong signals currently being given by short-term moving averages. There is no crossing of moving average by the price or crossing of moving averages between themselves.
Technical indicators are strongly bearish, suggesting that the price decline is expected to continue.
Caution: the Central Indicators scanner currently detects an excess:
CCI indicator is oversold : under -100
Type : Neutral
Timeframe : Daily
Williams %R indicator is oversold : under -80
Type : Neutral
Timeframe : Daily
Pivot points : price is under support 1
Type : Neutral
Timeframe : Weekly
The Central Patterns scanner, which studies chart patterns, resistances and supports, has identified this signal:
Near support of channel
Type : Bullish
Timeframe : Daily
No result was found by the Central Candlesticks scanner on Japanese candlesticks.
| S3 | S2 | S1 | Price | R1 | R2 | R3 | |
|---|---|---|---|---|---|---|---|
| ProTrendLines | 2.85 | 3.03 | 3.27 | 3.44 | 3.59 | 3.84 | 4.11 |
| Change (%) | -17.15% | -11.92% | -4.94% | - | +4.36% | +11.63% | +19.48% |
| Change | -0.59 | -0.41 | -0.17 | - | +0.15 | +0.40 | +0.67 |
| Level | Intermediate | Intermediate | Minor | - | Major | Major | Minor |
To determine price objectives, it is also possible to use the pivot points. Here is the price position in relation to pivot points:
| Pivot points | S3 | S2 | S1 | PP | R1 | R2 | R3 |
|---|---|---|---|---|---|---|---|
| Standard | 3.20 | 3.29 | 3.39 | 3.48 | 3.58 | 3.67 | 3.77 |
| Camarilla | 3.43 | 3.45 | 3.46 | 3.48 | 3.50 | 3.52 | 3.53 |
| Woodie | 3.20 | 3.29 | 3.39 | 3.48 | 3.58 | 3.67 | 3.77 |
| Fibonacci | 3.29 | 3.37 | 3.41 | 3.48 | 3.56 | 3.60 | 3.67 |
| Pivot points | S3 | S2 | S1 | PP | R1 | R2 | R3 |
|---|---|---|---|---|---|---|---|
| Standard | 3.24 | 3.39 | 3.49 | 3.64 | 3.74 | 3.89 | 3.99 |
| Camarilla | 3.53 | 3.55 | 3.58 | 3.60 | 3.62 | 3.65 | 3.67 |
| Woodie | 3.23 | 3.38 | 3.48 | 3.63 | 3.73 | 3.88 | 3.98 |
| Fibonacci | 3.39 | 3.48 | 3.54 | 3.64 | 3.73 | 3.79 | 3.89 |
| Pivot points | S3 | S2 | S1 | PP | R1 | R2 | R3 |
|---|---|---|---|---|---|---|---|
| Standard | 2.58 | 2.93 | 3.20 | 3.55 | 3.82 | 4.17 | 4.44 |
| Camarilla | 3.31 | 3.37 | 3.42 | 3.48 | 3.54 | 3.59 | 3.65 |
| Woodie | 2.55 | 2.91 | 3.17 | 3.53 | 3.79 | 4.15 | 4.41 |
| Fibonacci | 2.93 | 3.16 | 3.31 | 3.55 | 3.78 | 3.93 | 4.17 |
Numerical data
The following are the details of the technical indicators and moving averages that were collected to generate this technical analysis:
| RSI (14): | 30.86 | |
| MACD (12,26,9): | -0.0800 | |
| Directional Movement: | -23.40 | |
| AROON (14): | -78.57 | |
| DEMA (21): | 3.52 | |
| Parabolic SAR (0,02-0,02-0,2): | 3.61 | |
| Elder Ray (13): | -0.18 | |
| Super Trend (3,10): | 3.82 | |
| Zig ZAG (10): | 3.39 | |
| VORTEX (21): | 0.7900 | |
| Stochastique (14,3,5): | 35.52 | |
| TEMA (21): | 3.49 | |
| Williams %R (14): | -80.33 | |
| Chande Momentum Oscillator (20): | -0.35 | |
| Repulse (5,40,3): | -0.4600 | |
| ROCnROLL: | 2 | |
| TRIX (15,9): | -0.2300 | |
| Courbe Coppock: | 10.67 |
| MA7: | 3.53 | |
| MA20: | 3.65 | |
| MA50: | 3.76 | |
| MA100: | 3.92 | |
| MAexp7: | 3.52 | |
| MAexp20: | 3.63 | |
| MAexp50: | 3.75 | |
| MAexp100: | 3.87 | |
| Price / MA7: | -2.55% | |
| Price / MA20: | -5.75% | |
| Price / MA50: | -8.51% | |
| Price / MA100: | -12.24% | |
| Price / MAexp7: | -2.27% | |
| Price / MAexp20: | -5.23% | |
| Price / MAexp50: | -8.27% | |
| Price / MAexp100: | -11.11% |
News
The last news published on GENOWAY at the time of the generation of this analysis was as follows:
- SIGMA-ALDRICH AND GENOWAY EXPAND THEIR CRISPR/CAS9 STRATEGIC ALLIANCE
- SIGMA-ALDRICH AND GENOWAY EXPAND THEIR CRISPR/CAS9 STRATEGIC ALLIANCE
- genOway and Merck Strengthen CRISPR/Cas9 Strategic Alliance by Extending Their Partnership to All Animal Cell Models
- genOway and Merck Strengthen CRISPR/Cas9 Strategic Alliance by Extending Their Partnership to All Animal Cell Models
- genOway and Merck Strengthen CRISPR/Cas9 Strategic Alliance by Extending Their Partnership to All Animal Cell Models