Londinia Opportunities Analyses - 11/01/2024 (GMT) AIRBUS - 1H
| Type: | Stocks |
| Ticker: | AIR |
| ISIN: | NL0000235190 |
- Europe Stocks
- Timeframe : 1H
- - Analysis generated on
- Status : INVALID
Summary of the analysis
Additional analysis
Quotes
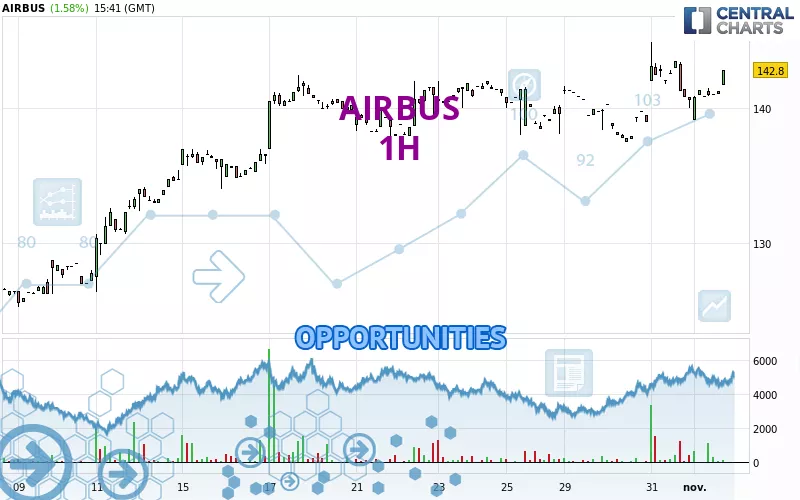
The AIRBUS price is 142.80 EUR. On the day, this instrument gained +1.58% and was traded between 139.10 EUR and 142.80 EUR over the period. The price is currently at +2.66% from its lowest and 0% from its highest.The Central Gaps scanner detects a bearish gap which is a sign that the sellers have taken the lead in the very short term.
Opening Gap DOWN
Type : Bearish
Timeframe : Openning
So that you have an overall view of the price change, here is a table showing the variations over several periods:
Near a new HIGH record (1 month)
Type : Bullish
Timeframe : Weekly
Technical
Technical analysis of AIRBUS in 1H shows a strongly overall bullish trend. The signals given by the moving averages are 92.86% bullish. This strong bullish trend is confirmed by the strong signals currently being given by short-term moving averages. The Central Indicators market scanner is currently detecting a bullish signal that could impact this trend:
Moving Average bullish crossovers : AMA20 & AMA50
Type : Bullish
Timeframe : 1 hour
In fact, 14 technical indicators on 18 studied are currently positioned bullish. But beware of excesses. The Central Indicators scanner currently detects this:
Williams %R indicator is overbought : over -20
Type : Neutral
Timeframe : 1 hour
MACD crosses UP its Moving Average
Type : Bullish
Timeframe : 1 hour
Price is back over the pivot point
Type : Bullish
Timeframe : 1 hour
Price is back over the pivot point
Type : Bullish
Timeframe : Weekly
Momentum indicator is back over 0
Type : Bullish
Timeframe : 1 hour
No signals are given by Central Patterns, a market scanner specialised in chart patterns, resistances and supports.
The Central Candlesticks scanner which studies Japanese candlesticks did not detect anything.
| S3 | S2 | S1 | Price | R1 | R2 | R3 | |
|---|---|---|---|---|---|---|---|
| ProTrendLines | 134.04 | 136.90 | 141.64 | 142.80 | 144.90 | 153.70 | 161.70 |
| Change (%) | -6.13% | -4.13% | -0.81% | - | +1.47% | +7.63% | +13.24% |
| Change | -8.76 | -5.90 | -1.16 | - | +2.10 | +10.90 | +18.90 |
| Level | Minor | Major | Major | - | Minor | Intermediate | Intermediate |
Pivot points can also be used to set your price objectives. Here is the price situation in relation to pivot points:
| Pivot points | S3 | S2 | S1 | PP | R1 | R2 | R3 |
|---|---|---|---|---|---|---|---|
| Standard | 133.92 | 136.98 | 138.78 | 141.84 | 143.64 | 146.70 | 148.50 |
| Camarilla | 139.24 | 139.69 | 140.14 | 140.58 | 141.03 | 141.47 | 141.92 |
| Woodie | 133.29 | 136.67 | 138.15 | 141.53 | 143.01 | 146.39 | 147.87 |
| Fibonacci | 136.98 | 138.84 | 139.98 | 141.84 | 143.70 | 144.84 | 146.70 |
| Pivot points | S3 | S2 | S1 | PP | R1 | R2 | R3 |
|---|---|---|---|---|---|---|---|
| Standard | 134.45 | 136.07 | 138.77 | 140.39 | 143.09 | 144.71 | 147.41 |
| Camarilla | 140.27 | 140.67 | 141.06 | 141.46 | 141.86 | 142.25 | 142.65 |
| Woodie | 134.98 | 136.34 | 139.30 | 140.66 | 143.62 | 144.98 | 147.94 |
| Fibonacci | 136.07 | 137.72 | 138.74 | 140.39 | 142.04 | 143.06 | 144.71 |
| Pivot points | S3 | S2 | S1 | PP | R1 | R2 | R3 |
|---|---|---|---|---|---|---|---|
| Standard | 107.89 | 116.15 | 128.37 | 136.63 | 148.85 | 157.11 | 169.33 |
| Camarilla | 134.95 | 136.83 | 138.70 | 140.58 | 142.46 | 144.34 | 146.21 |
| Woodie | 109.86 | 117.14 | 130.34 | 137.62 | 150.82 | 158.10 | 171.30 |
| Fibonacci | 116.15 | 123.98 | 128.81 | 136.63 | 144.46 | 149.29 | 157.11 |
Numerical data
The following are the details of the technical indicators and moving averages that were collected to generate this technical analysis:
| RSI (14): | 60.36 | |
| MACD (12,26,9): | 0.3500 | |
| Directional Movement: | 12.90 | |
| AROON (14): | -28.57 | |
| DEMA (21): | 141.59 | |
| Parabolic SAR (0,02-0,02-0,2): | 139.42 | |
| Elder Ray (13): | 0.92 | |
| Super Trend (3,10): | 139.88 | |
| Zig ZAG (10): | 142.80 | |
| VORTEX (21): | 0.8700 | |
| Stochastique (14,3,5): | 53.57 | |
| TEMA (21): | 141.77 | |
| Williams %R (14): | -16.29 | |
| Chande Momentum Oscillator (20): | 0.82 | |
| Repulse (5,40,3): | 0.9200 | |
| ROCnROLL: | 1 | |
| TRIX (15,9): | 0.0400 | |
| Courbe Coppock: | 0.65 |
| MA7: | 140.68 | |
| MA20: | 136.78 | |
| MA50: | 134.41 | |
| MA100: | 135.03 | |
| MAexp7: | 141.52 | |
| MAexp20: | 141.14 | |
| MAexp50: | 140.57 | |
| MAexp100: | 139.30 | |
| Price / MA7: | +1.51% | |
| Price / MA20: | +4.40% | |
| Price / MA50: | +6.24% | |
| Price / MA100: | +5.75% | |
| Price / MAexp7: | +0.90% | |
| Price / MAexp20: | +1.18% | |
| Price / MAexp50: | +1.59% | |
| Price / MAexp100: | +2.51% |