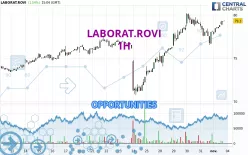
Londinia Opportunities Analyses - 11/01/2024 (GMT) LABORAT.ROVI - 1H
-
EUR
(-)
-
15 min delayed data - Spain Stocks
| Type: | Stocks |
| Ticker: | ROVI |
| ISIN: | ES0157261019 |
- Europe Stocks
- Timeframe : 1H
- - Analysis generated on 11/01/2024 - 15:25
- Status : INVALID
Summary of the analysis
Trends
Short term:
Bullish
Underlying:
Strongly bullish
Technical indicators
72%
6%
22%
My opinion
Bullish above 78.65 EUR
My targets
80.20 EUR (+1.20%)
82.25 EUR (+3.79%)
My analysis
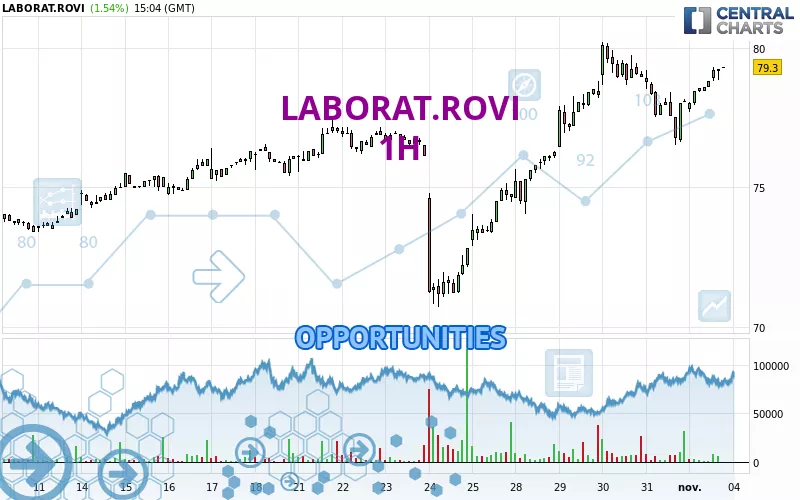
The basic bullish trend is very strong on LABORAT.ROVI but the short term shows some signs of running out of steam. However, a purchase could be considered as long as the price remains above 78.65 EUR. Crossing the first resistance at 80.20 EUR would be a sign of a potential new surge in the price. Buyers would then use the next resistance located at 82.25 EUR as an objective. Crossing it would then enable buyers to target 84.96 EUR. Caution, a return to below 78.65 EUR would be a sign of a consolidation phase in the short-term basic trend. If this is the case, remember that trading against the trend may be riskier. It would seem more appropriate to wait for a signal indicating reversal of the trend.
Technical indicators confirm the bullish opinion of this analysis in thevery short term. However, be careful of excessive bullish movements. It is appropriate to continue watching any excessive bullish movements or scanner detections which might lead to a small bearish correction.
Force
0
10
7.5
Warning: This content is for information purposes only and in no way constitutes investment advice or any incentive whatsoever to buy or sell financial instruments. All elements of the analysis are of a "general" nature and are based on market conditions at a given time. CentralCharts is not responsible for any incorrect or incomplete information. Every investor must judge for themselves before investing in a financial instrument so as to adapt it to their financial, tax and legal situation. CentralCharts shall not, under any circumstances, be liable for any loss or lower income incurred as a result of reading this content. Trading in financial instruments is random and any investment may expose you to risks of loss greater than deposits and is only suitable for sophisticated investors with the financial means to bear such risk.
Additional analysis
Quotes
The LABORAT.ROVI rating is 79.25 EUR. On the day, this instrument gained +1.47% with the lowest point at 77.70 EUR and the highest point at 79.30 EUR. The deviation from the price is +1.99% for the low point and -0.06% for the high point.77.70
79.30
79.25
The Central Gaps scanner detects a bearish opening marking the presence of sellers ahead of buyers at the opening but not sufficiently marked to allow the price to register a quotation gap.
Bearish opening
Type : Bearish
Timeframe : Openning
So that you have an overall view of the price change, here is a table showing the variations over several periods:
Near a new HIGH record (1 month)
Type : Bullish
Timeframe : Weekly
Technical
Technical analysis of LABORAT.ROVI in 1H shows a strongly overall bullish trend. 89.29% of the signals given by moving averages are bullish. The slightly bullish signals given by the short-term moving averages indicate this trend is showing signs of running out of steam. There is no crossing of moving average by the price or crossing of moving averages between themselves.
An assessment of technical indicators shows a strong bullish signal.
But beware of excesses. The Central Indicators scanner currently detects this:
Williams %R indicator is overbought : over -20
Type : Neutral
Timeframe : 1 hour
Pivot points : price is over resistance 1
Type : Neutral
Timeframe : Weekly
Central Patterns, the scanner specializing in chart patterns, did not identify any signals.
The Central Candlesticks scanner which studies Japanese candlesticks did not detect anything.
ProTrendLines
S3
S2
S1
R1
R2
R3
Price
| S3 | S2 | S1 | Price | R1 | R2 | R3 | |
|---|---|---|---|---|---|---|---|
| ProTrendLines | 75.00 | 77.53 | 78.65 | 79.25 | 79.48 | 80.20 | 82.25 |
| Change (%) | -5.36% | -2.17% | -0.76% | - | +0.29% | +1.20% | +3.79% |
| Change | -4.25 | -1.72 | -0.60 | - | +0.23 | +0.95 | +3.00 |
| Level | Major | Intermediate | Minor | - | Minor | Major | Major |
Pivot points can also be used to set your price objectives. Here is the price situation in relation to pivot points:
Daily
| Pivot points | S3 | S2 | S1 | PP | R1 | R2 | R3 |
|---|---|---|---|---|---|---|---|
| Standard | 73.97 | 75.23 | 76.67 | 77.93 | 79.37 | 80.63 | 82.07 |
| Camarilla | 77.36 | 77.61 | 77.85 | 78.10 | 78.35 | 78.60 | 78.84 |
| Woodie | 74.05 | 75.28 | 76.75 | 77.98 | 79.45 | 80.68 | 82.15 |
| Fibonacci | 75.23 | 76.27 | 76.90 | 77.93 | 78.97 | 79.60 | 80.63 |
Weekly
| Pivot points | S3 | S2 | S1 | PP | R1 | R2 | R3 |
|---|---|---|---|---|---|---|---|
| Standard | 64.27 | 67.48 | 71.12 | 74.33 | 77.97 | 81.18 | 84.82 |
| Camarilla | 72.87 | 73.49 | 74.12 | 74.75 | 75.38 | 76.01 | 76.63 |
| Woodie | 64.48 | 67.59 | 71.33 | 74.44 | 78.18 | 81.29 | 85.03 |
| Fibonacci | 67.48 | 70.10 | 71.72 | 74.33 | 76.95 | 78.57 | 81.18 |
Monthly
| Pivot points | S3 | S2 | S1 | PP | R1 | R2 | R3 |
|---|---|---|---|---|---|---|---|
| Standard | 62.97 | 66.83 | 72.47 | 76.33 | 81.97 | 85.83 | 91.47 |
| Camarilla | 75.49 | 76.36 | 77.23 | 78.10 | 78.97 | 79.84 | 80.71 |
| Woodie | 63.85 | 67.28 | 73.35 | 76.78 | 82.85 | 86.28 | 92.35 |
| Fibonacci | 66.83 | 70.46 | 72.70 | 76.33 | 79.96 | 82.20 | 85.83 |
Numerical data
The following is the status of technical indicators and moving averages registered at the time this technical analysis was created:
Technical indicators
Moving averages
| RSI (14): | 61.12 | |
| MACD (12,26,9): | 0.3500 | |
| Directional Movement: | 7.82 | |
| AROON (14): | 57.15 | |
| DEMA (21): | 78.88 | |
| Parabolic SAR (0,02-0,02-0,2): | 77.14 | |
| Elder Ray (13): | 0.50 | |
| Super Trend (3,10): | 77.55 | |
| Zig ZAG (10): | 79.20 | |
| VORTEX (21): | 0.9900 | |
| Stochastique (14,3,5): | 92.68 | |
| TEMA (21): | 78.72 | |
| Williams %R (14): | -3.57 | |
| Chande Momentum Oscillator (20): | 1.25 | |
| Repulse (5,40,3): | 1.0800 | |
| ROCnROLL: | 1 | |
| TRIX (15,9): | 0.0600 | |
| Courbe Coppock: | 0.18 |
| MA7: | 76.91 | |
| MA20: | 75.75 | |
| MA50: | 75.47 | |
| MA100: | 79.18 | |
| MAexp7: | 78.77 | |
| MAexp20: | 78.39 | |
| MAexp50: | 77.55 | |
| MAexp100: | 76.61 | |
| Price / MA7: | +3.04% | |
| Price / MA20: | +4.62% | |
| Price / MA50: | +5.01% | |
| Price / MA100: | +0.09% | |
| Price / MAexp7: | +0.61% | |
| Price / MAexp20: | +1.10% | |
| Price / MAexp50: | +2.19% | |
| Price / MAexp100: | +3.45% |
Quotes :
11/01/2024 - 14:55
-
15 min delayed data
-
Actions Espagne
News
The latest news and videos published on LABORAT.ROVI at the time of the analysis were as follows:
- 12/11/2020 - 08:00 Laboratorios Farmacéuticos ROVI (ROVI): All good things come in threes
- 12/04/2019 - 15:22 Edison Investment Research Limited: Edison issues outlook on Laboratorios Farmacéuticos ROVI (ROVI)