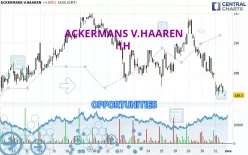
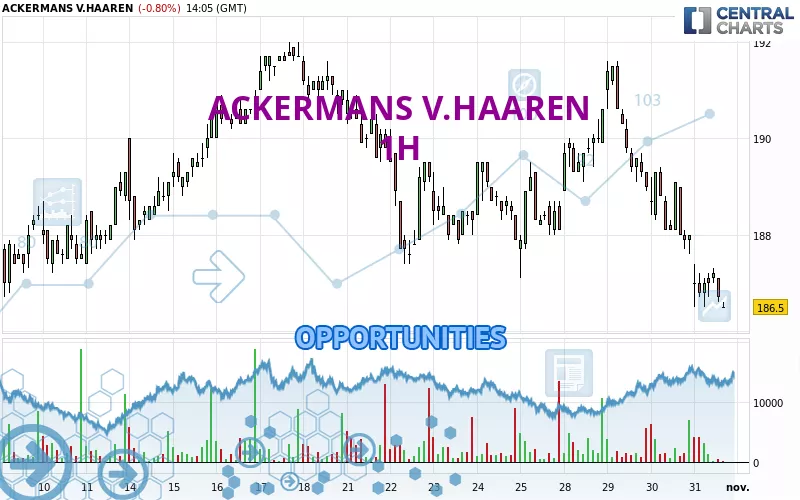
Londinia Opportunities Analyses - 10/31/2024 (GMT) ACKERMANS V.HAAREN - 1H
| Type: | Stocks |
| Ticker: | ACKB |
| ISIN: | BE0003764785 |
- Europe Stocks
- Timeframe : 1H
- - Analysis generated on
- Status : INVALID
Summary of the analysis
Additional analysis
Quotes
The ACKERMANS V.HAAREN rating is 186.7 EUR. The price is lower by -0.69% since the last closing and was between 186.5 EUR and 187.4 EUR. This implies that the price is at +0.11% from its lowest and at -0.37% from its highest.The Central Gaps scanner detects a bearish gap which is a sign that the sellers have taken the lead in the very short term.
Opening Gap DOWN
Type : Bearish
Timeframe : Openning
So that you have an overall view of the price change, here is a table showing the variations over several periods:
Near a new HIGH record (5 years)
Type : Bullish
Timeframe : Weekly
Near a new HIGH record (1 year)
Type : Bullish
Timeframe : Weekly
Near a new HIGH record (1st january)
Type : Bullish
Timeframe : Weekly
Near a new HIGH record (1 month)
Type : Bullish
Timeframe : Weekly
Technical
Technical analysis of ACKERMANS V.HAAREN in 1H shows a overall strongly bearish trend. 92.86% of the signals given by moving averages are bearish. This strongly bearish trend is supported by the strong bearish signals given by short-term moving averages. The Central Indicators market scanner currently does not detect any result that concerns moving averages.
The probability of a further decline is moderate given the direction of the technical indicators.
But beware of excesses. The Central Indicators scanner currently detects this:
CCI indicator is oversold : under -100
Type : Neutral
Timeframe : 1 hour
Williams %R indicator is oversold : under -80
Type : Neutral
Timeframe : 1 hour
Pivot points : price is under support 1
Type : Neutral
Timeframe : 1 hour
Price is back under the pivot point
Type : Bearish
Timeframe : Weekly
An analysis of the price chart with the Central Patterns scanner (detector of chart patterns and resistances and supports) shows several results that can have an impact on the price change:
Near horizontal support
Type : Bullish
Timeframe : 1 hour
Support of channel is broken
Type : Bearish
Timeframe : 1 hour
The Central Candlesticks scanner which studies Japanese candlesticks did not detect anything.
| S3 | S2 | S1 | Price | R1 | R2 | R3 | |
|---|---|---|---|---|---|---|---|
| ProTrendLines | 177.6 | 184.5 | 185.4 | 186.7 | 187.1 | 187.8 | 189.5 |
| Change (%) | -4.87% | -1.18% | -0.70% | - | +0.21% | +0.59% | +1.50% |
| Change | -9.1 | -2.2 | -1.3 | - | +0.4 | +1.1 | +2.8 |
| Level | Minor | Intermediate | Major | - | Intermediate | Minor | Intermediate |
To determine price objectives, it is also possible to use the pivot points. Here is the price position in relation to pivot points:
| Pivot points | S3 | S2 | S1 | PP | R1 | R2 | R3 |
|---|---|---|---|---|---|---|---|
| Standard | 185.5 | 186.5 | 187.3 | 188.3 | 189.1 | 190.1 | 190.9 |
| Camarilla | 187.5 | 187.7 | 187.8 | 188.0 | 188.2 | 188.3 | 188.5 |
| Woodie | 185.3 | 186.5 | 187.1 | 188.3 | 188.9 | 190.1 | 190.7 |
| Fibonacci | 186.5 | 187.2 | 187.7 | 188.3 | 189.0 | 189.5 | 190.1 |
| Pivot points | S3 | S2 | S1 | PP | R1 | R2 | R3 |
|---|---|---|---|---|---|---|---|
| Standard | 182.6 | 184.8 | 186.5 | 188.7 | 190.4 | 192.6 | 194.3 |
| Camarilla | 187.0 | 187.4 | 187.7 | 188.1 | 188.5 | 188.8 | 189.2 |
| Woodie | 182.3 | 184.7 | 186.2 | 188.6 | 190.1 | 192.5 | 194.0 |
| Fibonacci | 184.8 | 186.3 | 187.2 | 188.7 | 190.2 | 191.1 | 192.6 |
| Pivot points | S3 | S2 | S1 | PP | R1 | R2 | R3 |
|---|---|---|---|---|---|---|---|
| Standard | 166.0 | 172.2 | 181.4 | 187.6 | 196.8 | 203.0 | 212.2 |
| Camarilla | 186.5 | 187.9 | 189.3 | 190.7 | 192.1 | 193.5 | 194.9 |
| Woodie | 167.6 | 173.0 | 183.0 | 188.4 | 198.4 | 203.8 | 213.8 |
| Fibonacci | 172.2 | 178.1 | 181.7 | 187.6 | 193.5 | 197.1 | 203.0 |
Numerical data
The following is the status of the technical indicators and moving averages at the time of publication of this technical analysis:
| RSI (14): | 34.70 | |
| MACD (12,26,9): | -0.7000 | |
| Directional Movement: | -18.3 | |
| AROON (14): | -50.0 | |
| DEMA (21): | 187.2 | |
| Parabolic SAR (0,02-0,02-0,2): | 187.3 | |
| Elder Ray (13): | -0.7 | |
| Super Trend (3,10): | 188.8 | |
| Zig ZAG (10): | 186.7 | |
| VORTEX (21): | 0.7000 | |
| Stochastique (14,3,5): | 14.90 | |
| TEMA (21): | 186.7 | |
| Williams %R (14): | -96.60 | |
| Chande Momentum Oscillator (20): | -2.2 | |
| Repulse (5,40,3): | -0.3000 | |
| ROCnROLL: | 2 | |
| TRIX (15,9): | 0.0000 | |
| Courbe Coppock: | 2.20 |
| MA7: | 188.4 | |
| MA20: | 188.8 | |
| MA50: | 185.6 | |
| MA100: | 177.2 | |
| MAexp7: | 187.2 | |
| MAexp20: | 188.0 | |
| MAexp50: | 188.7 | |
| MAexp100: | 189.0 | |
| Price / MA7: | -0.90% | |
| Price / MA20: | -1.11% | |
| Price / MA50: | +0.59% | |
| Price / MA100: | +5.36% | |
| Price / MAexp7: | -0.27% | |
| Price / MAexp20: | -0.69% | |
| Price / MAexp50: | -1.06% | |
| Price / MAexp100: | -1.22% |
News
Don't forget to follow the news on ACKERMANS V.HAAREN. At the time of publication of this analysis, the latest news was as follows:
- Ackermans & van Haare invests in V.Group, a leading provider of marine support services
- Ackermans & van Haaren reports outstanding Q1-results at both DEME and at the private banks Delen and Van Breda, and gives confirmation of guidance: net profit of 2024 expected to be higher than last year
- Ackermans & van Haaren realises a record profit of 278.4 million euros over the first half of 2022
- Ackermans & van Haaren realised a record result of 407 million euros over the full year 2021
- Ackermans & van Haaren still on course for record result over the full year 2021