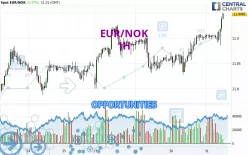
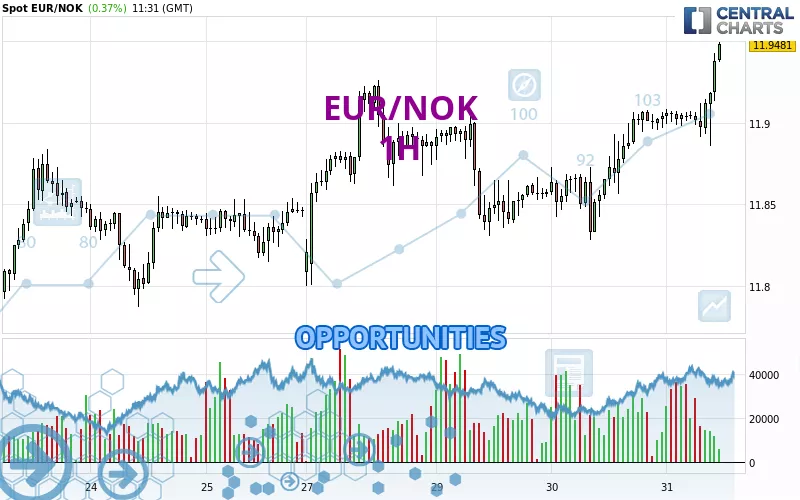
Londinia Opportunities Analyses - 10/31/2024 (GMT) EUR/NOK - 1H
- FX/Indices
- Timeframe : 1H
- - Analysis generated on
- Status : LEVEL MAINTAINED
Summary of the analysis
Additional analysis
Quotes
EUR/NOK rating 11.9453 NOK. The price registered an increase of +0.35% on the session and was between 11.8856 NOK and 11.9495 NOK. This implies that the price is at +0.50% from its lowest and at -0.04% from its highest.A study of price movements over other periods shows the following variations:
Near a new HIGH record (1 year)
Type : Bullish
Timeframe : Weekly
Near a new HIGH record (1st january)
Type : Bullish
Timeframe : Weekly
New HIGH record (1 month)
Type : Bullish
Timeframe : Weekly
Technical
A technical analysis in 1H of this EUR/NOK chart shows a strongly bullish trend. 92.86% of the signals given by moving averages are bullish. This strongly bullish trend is supported by the strong bullish signals given by short-term moving averages. The Central Indicators scanner does not detect any result on moving averages that would impact this trend.
In fact, according to the parameters integrated into the Central Analyzer system, 15 technical indicators out of 18 analysed are currently bullish. Other results related to technical indicators were also found by the Central Indicators scanner:
Pivot points : price is over resistance 1
Type : Neutral
Timeframe : 1 hour
Pivot points : price is over resistance 1
Type : Neutral
Timeframe : Weekly
Central Patterns, the market scanner focusing on chart patterns, resistances and supports found these results:
Near horizontal resistance
Type : Bearish
Timeframe : 1 hour
Resistance of channel is broken
Type : Bullish
Timeframe : 1 hour
The Central Candlesticks scanner, specialised in Japanese candlesticks, did not identify any signals.
| S3 | S2 | S1 | Price | R1 | R2 | |
|---|---|---|---|---|---|---|
| ProTrendLines | 11.8837 | 11.9076 | 11.9260 | 11.9453 | 11.9957 | 12.5716 |
| Change (%) | -0.52% | -0.32% | -0.16% | - | +0.42% | +5.24% |
| Change | -0.0616 | -0.0377 | -0.0193 | - | +0.0504 | +0.6263 |
| Level | Intermediate | Minor | Major | - | Major | Minor |
Attention could also be paid to pivot points to set price objectives:
| Pivot points | S3 | S2 | S1 | PP | R1 | R2 | R3 |
|---|---|---|---|---|---|---|---|
| Standard | 11.7725 | 11.8003 | 11.8521 | 11.8799 | 11.9317 | 11.9595 | 12.0113 |
| Camarilla | 11.8821 | 11.8894 | 11.8967 | 11.9040 | 11.9113 | 11.9186 | 11.9259 |
| Woodie | 11.7846 | 11.8063 | 11.8642 | 11.8859 | 11.9438 | 11.9655 | 12.0234 |
| Fibonacci | 11.8003 | 11.8307 | 11.8495 | 11.8799 | 11.9103 | 11.9291 | 11.9595 |
| Pivot points | S3 | S2 | S1 | PP | R1 | R2 | R3 |
|---|---|---|---|---|---|---|---|
| Standard | 11.6676 | 11.7247 | 11.7857 | 11.8428 | 11.9038 | 11.9609 | 12.0219 |
| Camarilla | 11.8141 | 11.8250 | 11.8358 | 11.8466 | 11.8574 | 11.8683 | 11.8791 |
| Woodie | 11.6695 | 11.7257 | 11.7876 | 11.8438 | 11.9057 | 11.9619 | 12.0238 |
| Fibonacci | 11.7247 | 11.7699 | 11.7977 | 11.8428 | 11.8880 | 11.9158 | 11.9609 |
| Pivot points | S3 | S2 | S1 | PP | R1 | R2 | R3 |
|---|---|---|---|---|---|---|---|
| Standard | 11.1552 | 11.3782 | 11.5626 | 11.7856 | 11.9700 | 12.1930 | 12.3774 |
| Camarilla | 11.6349 | 11.6722 | 11.7096 | 11.7469 | 11.7843 | 11.8216 | 11.8589 |
| Woodie | 11.1358 | 11.3686 | 11.5432 | 11.7760 | 11.9506 | 12.1834 | 12.3580 |
| Fibonacci | 11.3782 | 11.5339 | 11.6300 | 11.7856 | 11.9413 | 12.0374 | 12.1930 |
Numerical data
The following is the status of technical indicators and moving averages registered at the time this technical analysis was created:
| RSI (14): | 76.22 | |
| MACD (12,26,9): | 0.0134 | |
| Directional Movement: | 7.4073 | |
| AROON (14): | 7.1428 | |
| DEMA (21): | 11.9226 | |
| Parabolic SAR (0,02-0,02-0,2): | 11.8856 | |
| Elder Ray (13): | 0.0265 | |
| Super Trend (3,10): | 11.8946 | |
| Zig ZAG (10): | 11.9410 | |
| VORTEX (21): | 1.3063 | |
| Stochastique (14,3,5): | 96.26 | |
| TEMA (21): | 11.9291 | |
| Williams %R (14): | -1.93 | |
| Chande Momentum Oscillator (20): | 0.0374 | |
| Repulse (5,40,3): | 0.3198 | |
| ROCnROLL: | 1 | |
| TRIX (15,9): | 0.0136 | |
| Courbe Coppock: | 0.32 |
| MA7: | 11.8753 | |
| MA20: | 11.8121 | |
| MA50: | 11.7841 | |
| MA100: | 11.7272 | |
| MAexp7: | 11.9224 | |
| MAexp20: | 11.9058 | |
| MAexp50: | 11.8889 | |
| MAexp100: | 11.8763 | |
| Price / MA7: | +0.59% | |
| Price / MA20: | +1.13% | |
| Price / MA50: | +1.37% | |
| Price / MA100: | +1.86% | |
| Price / MAexp7: | +0.19% | |
| Price / MAexp20: | +0.33% | |
| Price / MAexp50: | +0.47% | |
| Price / MAexp100: | +0.58% |