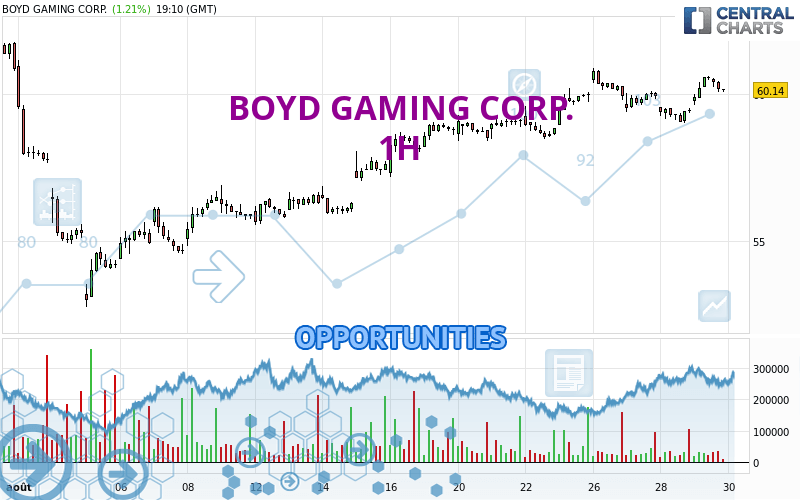
Londinia Opportunities Analyses - 08/29/2024 (GMT) BOYD GAMING CORP. - 1H
- U.S. Stocks
- Timeframe : 1H
- - Analysis generated on
- Status : INVALID
Summary of the analysis
Trends
Short term:
Strongly bullish
Underlying:
Strongly bullish
Technical indicators
72%
0%
28%
My opinion
Bullish above 59.36 USD
My targets
61.77 USD (+2.69%)
63.84 USD (+6.13%)
My analysis
All elements being clearly bullish, it would be possible for traders to trade only long positions (at the time of purchase) on BOYD GAMING CORP. as long as the price remains well above 59.36 USD. The buyers' bullish objective is set at 61.77 USD. A bullish break in this resistance would boost the bullish momentum. The buyers could then target the resistance located at 63.84 USD. If there is any crossing, the next objective would be the resistance located at 67.30 USD. However, beware of bullish excesses that could lead to a possible short-term correction; but this possible correction would not be tradeable.
Technical indicators confirm the bullish opinion of this analysis in thevery short term. However, be careful of excessive bullish movements. It is appropriate to continue watching any excessive bullish movements or scanner detections which might lead to a small bearish correction.
Force
0
10
8.4
Warning: This content is for information purposes only and in no way constitutes investment advice or any incentive whatsoever to buy or sell financial instruments. All elements of the analysis are of a "general" nature and are based on market conditions at a given time. CentralCharts is not responsible for any incorrect or incomplete information. Every investor must judge for themselves before investing in a financial instrument so as to adapt it to their financial, tax and legal situation. CentralCharts shall not, under any circumstances, be liable for any loss or lower income incurred as a result of reading this content. Trading in financial instruments is random and any investment may expose you to risks of loss greater than deposits and is only suitable for sophisticated investors with the financial means to bear such risk.
Additional analysis
Quotes
BOYD GAMING CORP. rating 60.15 USD. The price registered an increase of +1.23% on the session and was between 59.62 USD and 60.63 USD. This implies that the price is at +0.89% from its lowest and at -0.79% from its highest.59.62
60.63
60.15
The Central Gaps scanner detects a bullish gap which is a sign that buyers have taken the lead in the very short term.
Opening Gap UP
Type : Bullish
Timeframe : Openning
So that you have an overall view of the price change, here is a table showing the variations over several periods:
Near a new HIGH record (1 month)
Type : Bullish
Timeframe : Weekly
Technical
Technical analysis of this 1H chart of BOYD GAMING CORP. indicates that the overall trend is strongly bullish. 92.86% of the signals given by moving averages are bullish. The overall trend is supported by the strong bullish signals from short-term moving averages. The Central Indicators market scanner currently does not detect any result that concerns moving averages.
The probability of a further increase is high given the direction of the technical indicators.
Central Indicators, the detector scanner for these technical indicators recently detected a signal:
Pivot points : price is over resistance 3
Type : Neutral
Timeframe : 1 hour
The Central Patterns scanner, which studies chart patterns, resistances and supports, has identified this signal:
Near resistance of channel
Type : Bearish
Timeframe : 1 hour
The Central Candlesticks scanner, specialised in Japanese candlesticks, did not identify any signals.
ProTrendLines
S3
S2
S1
R1
R2
R3
Price
| S3 | S2 | S1 | Price | R1 | R2 | R3 | |
|---|---|---|---|---|---|---|---|
| ProTrendLines | 54.56 | 57.18 | 59.36 | 60.15 | 60.39 | 61.77 | 63.84 |
| Change (%) | -9.29% | -4.94% | -1.31% | - | +0.40% | +2.69% | +6.13% |
| Change | -5.59 | -2.97 | -0.79 | - | +0.24 | +1.62 | +3.69 |
| Level | Minor | Major | Intermediate | - | Major | Minor | Major |
Attention could also be paid to pivot points to set price objectives:
Daily
| Pivot points | S3 | S2 | S1 | PP | R1 | R2 | R3 |
|---|---|---|---|---|---|---|---|
| Standard | 58.56 | 58.79 | 59.11 | 59.34 | 59.66 | 59.89 | 60.21 |
| Camarilla | 59.27 | 59.32 | 59.37 | 59.42 | 59.47 | 59.52 | 59.57 |
| Woodie | 58.60 | 58.81 | 59.15 | 59.36 | 59.70 | 59.91 | 60.25 |
| Fibonacci | 58.79 | 59.00 | 59.13 | 59.34 | 59.55 | 59.68 | 59.89 |
Weekly
| Pivot points | S3 | S2 | S1 | PP | R1 | R2 | R3 |
|---|---|---|---|---|---|---|---|
| Standard | 56.76 | 57.49 | 58.76 | 59.49 | 60.76 | 61.49 | 62.76 |
| Camarilla | 59.48 | 59.66 | 59.85 | 60.03 | 60.21 | 60.40 | 60.58 |
| Woodie | 57.03 | 57.63 | 59.03 | 59.63 | 61.03 | 61.63 | 63.03 |
| Fibonacci | 57.49 | 58.25 | 58.73 | 59.49 | 60.25 | 60.73 | 61.49 |
Monthly
| Pivot points | S3 | S2 | S1 | PP | R1 | R2 | R3 |
|---|---|---|---|---|---|---|---|
| Standard | 44.22 | 48.78 | 54.83 | 59.39 | 65.44 | 70.00 | 76.05 |
| Camarilla | 57.95 | 58.93 | 59.90 | 60.87 | 61.84 | 62.82 | 63.79 |
| Woodie | 44.96 | 49.15 | 55.57 | 59.76 | 66.18 | 70.37 | 76.79 |
| Fibonacci | 48.78 | 52.84 | 55.34 | 59.39 | 63.45 | 65.95 | 70.00 |
Numerical data
The following is the status of the technical indicators and moving averages at the time of publication of this technical analysis:
Technical indicators
Moving averages
| RSI (14): | 65.05 | |
| MACD (12,26,9): | 0.1600 | |
| Directional Movement: | 14.76 | |
| AROON (14): | 35.71 | |
| DEMA (21): | 60.04 | |
| Parabolic SAR (0,02-0,02-0,2): | 59.19 | |
| Elder Ray (13): | 0.67 | |
| Super Trend (3,10): | 59.57 | |
| Zig ZAG (10): | 60.58 | |
| VORTEX (21): | 1.0400 | |
| Stochastique (14,3,5): | 93.85 | |
| TEMA (21): | 60.01 | |
| Williams %R (14): | -1.88 | |
| Chande Momentum Oscillator (20): | 0.52 | |
| Repulse (5,40,3): | 0.7500 | |
| ROCnROLL: | 1 | |
| TRIX (15,9): | 0.0200 | |
| Courbe Coppock: | 0.16 |
| MA7: | 59.69 | |
| MA20: | 57.54 | |
| MA50: | 57.11 | |
| MA100: | 56.65 | |
| MAexp7: | 60.09 | |
| MAexp20: | 59.76 | |
| MAexp50: | 59.38 | |
| MAexp100: | 58.79 | |
| Price / MA7: | +0.77% | |
| Price / MA20: | +4.54% | |
| Price / MA50: | +5.32% | |
| Price / MA100: | +6.18% | |
| Price / MAexp7: | +0.10% | |
| Price / MAexp20: | +0.65% | |
| Price / MAexp50: | +1.30% | |
| Price / MAexp100: | +2.31% |
Quotes :
-
15 min delayed data
-
Actions NYSE
News
The last news published on BOYD GAMING CORP. at the time of the generation of this analysis was as follows:
- BOYD GAMING ANNOUNCES QUARTERLY DIVIDEND
- Thinking about trading options or stock in TAL Education, Vera Therapeutics, MarineMax, General Motors, or Boyd Gaming?
- Boyd Gaming Announces Quarterly Dividend
- Boyd Gaming Reports Second-Quarter 2023 Results
- Boyd Gaming to Report Second-Quarter 2023 Results, Host Conference Call and Webcast on July 27